Graphic Design: The New Basics: Second Edition, Revised and Expanded (2015)
Point, Line, Plane
A line is the track made by the moving point … It is created by movement—specifically through the destruction of the intense, self-contained repose of the point. Wassily Kandinsky
Point, line, and plane are the building blocks of design. From these elements, designers create images, icons, textures, patterns, diagrams, animations, and typographic systems. Indeed, every complex design shown in this book results at some level from the interaction of points, lines, and planes.
Diagrams build relationships among elements using points, lines, and planes to map and connect data. Textures and patterns are constructed from large groups of points and lines that repeat, rotate, and otherwise interact to form distinctive and engaging surfaces. Typography consists of individual letters (points) that form into lines and fields of text.
For hundreds of years, printing processes have employed dots and lines to depict light, shadow, and volume. Different printing technologies support distinct kinds of mark making. To produce a woodcut, for example, the artist carves out material from a flat surface. In contrast to this subtractive process, lithography allows the artist to make positive, additive marks across a surface. In these processes, dots and lines accumulate to build larger planes and convey the illusion of volume.
Photography, invented in the early 1800s, captures reflected light automatically. The subtle tonal variations of photography eliminated the intermediary mesh of point and line.
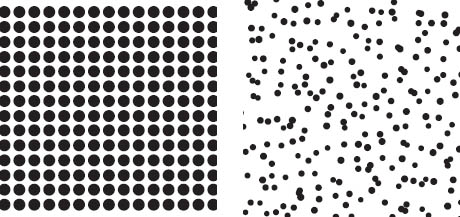
Yet reproducing the tones of a photographic image requires translating it into pure graphic marks, because nearly every mechanical printing method—from lithography to laser printing—works with solid inks. The halftone process, invented in the 1880s and still used today, converts a photograph into a pattern of larger and smaller dots, simulating tonal variation with pure spots of black or flat color. The same principle is used in digital reproduction.
Today, designers use software to capture the gestures of the hand as data that can be endlessly manipulated and refined. Software describes images in terms of point, line, plane, shape, and volume as well as color, transparency, and other features. There are numerous ways to experiment with these basic elements of two-dimensional design: observing the environment around you, making marks with physical and digital tools, using software to create and manipulate images, or writing code to generate form with rules and variables.
Point to Line Processing is a programming language created by C. E. B. Reas and Benjamin Fry. In this digital drawing by Reas, the lines express a relationship among the points, derived from numerical data. C. E. B. Reas, Process 4 (Form/Data 1), 2005 (detail).
Point
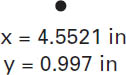
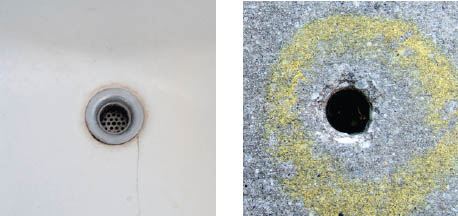
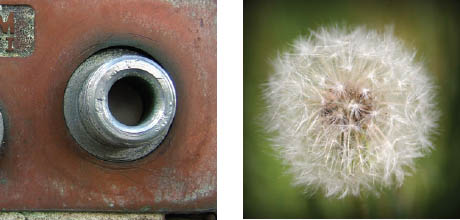
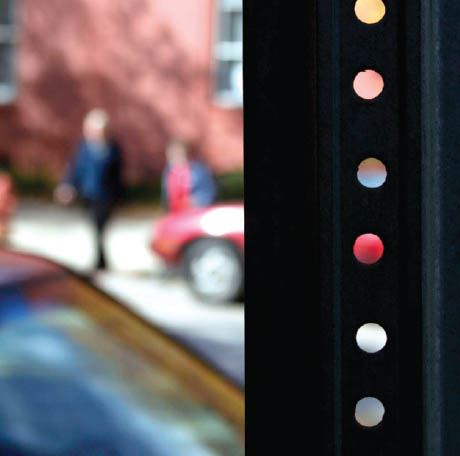
A point marks a position in space. In pure geometric terms, a point is a pair of x, y coordinates. It has no mass at all. Graphically, however, a point takes form as a dot, a visible mark. A point can be an insignificant fleck of matter or a concentrated locus of power. It can penetrate like a bullet, pierce like a nail, or pucker like a kiss. Through its scale, position, and relationship to its surroundings, a point can express its own identity or melt into the crowd.
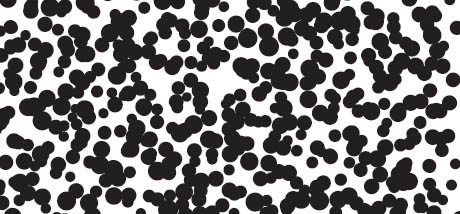
A series of points forms a line. A mass of points becomes texture, shape, or plane. Tiny points of varying size create shades of gray.
The tip of an arrow points the way, just as the crossing of an X marks a spot.
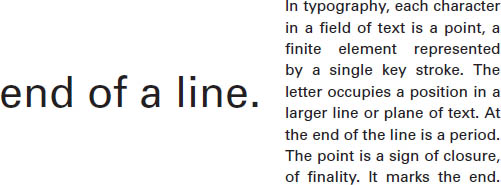
In typography, the point is a period—the definitive end of a line. Each character in a field of text is a singular element, and thus a kind of point, a finite element in a series.
Jason Okutake
Ryan Gladhill
Ryan Gladhill
Lauretta Dolch
Lauretta Dolch
Summer Underwood
Robert Ferrell
Digital Imaging. Al Maskeroni, faculty.
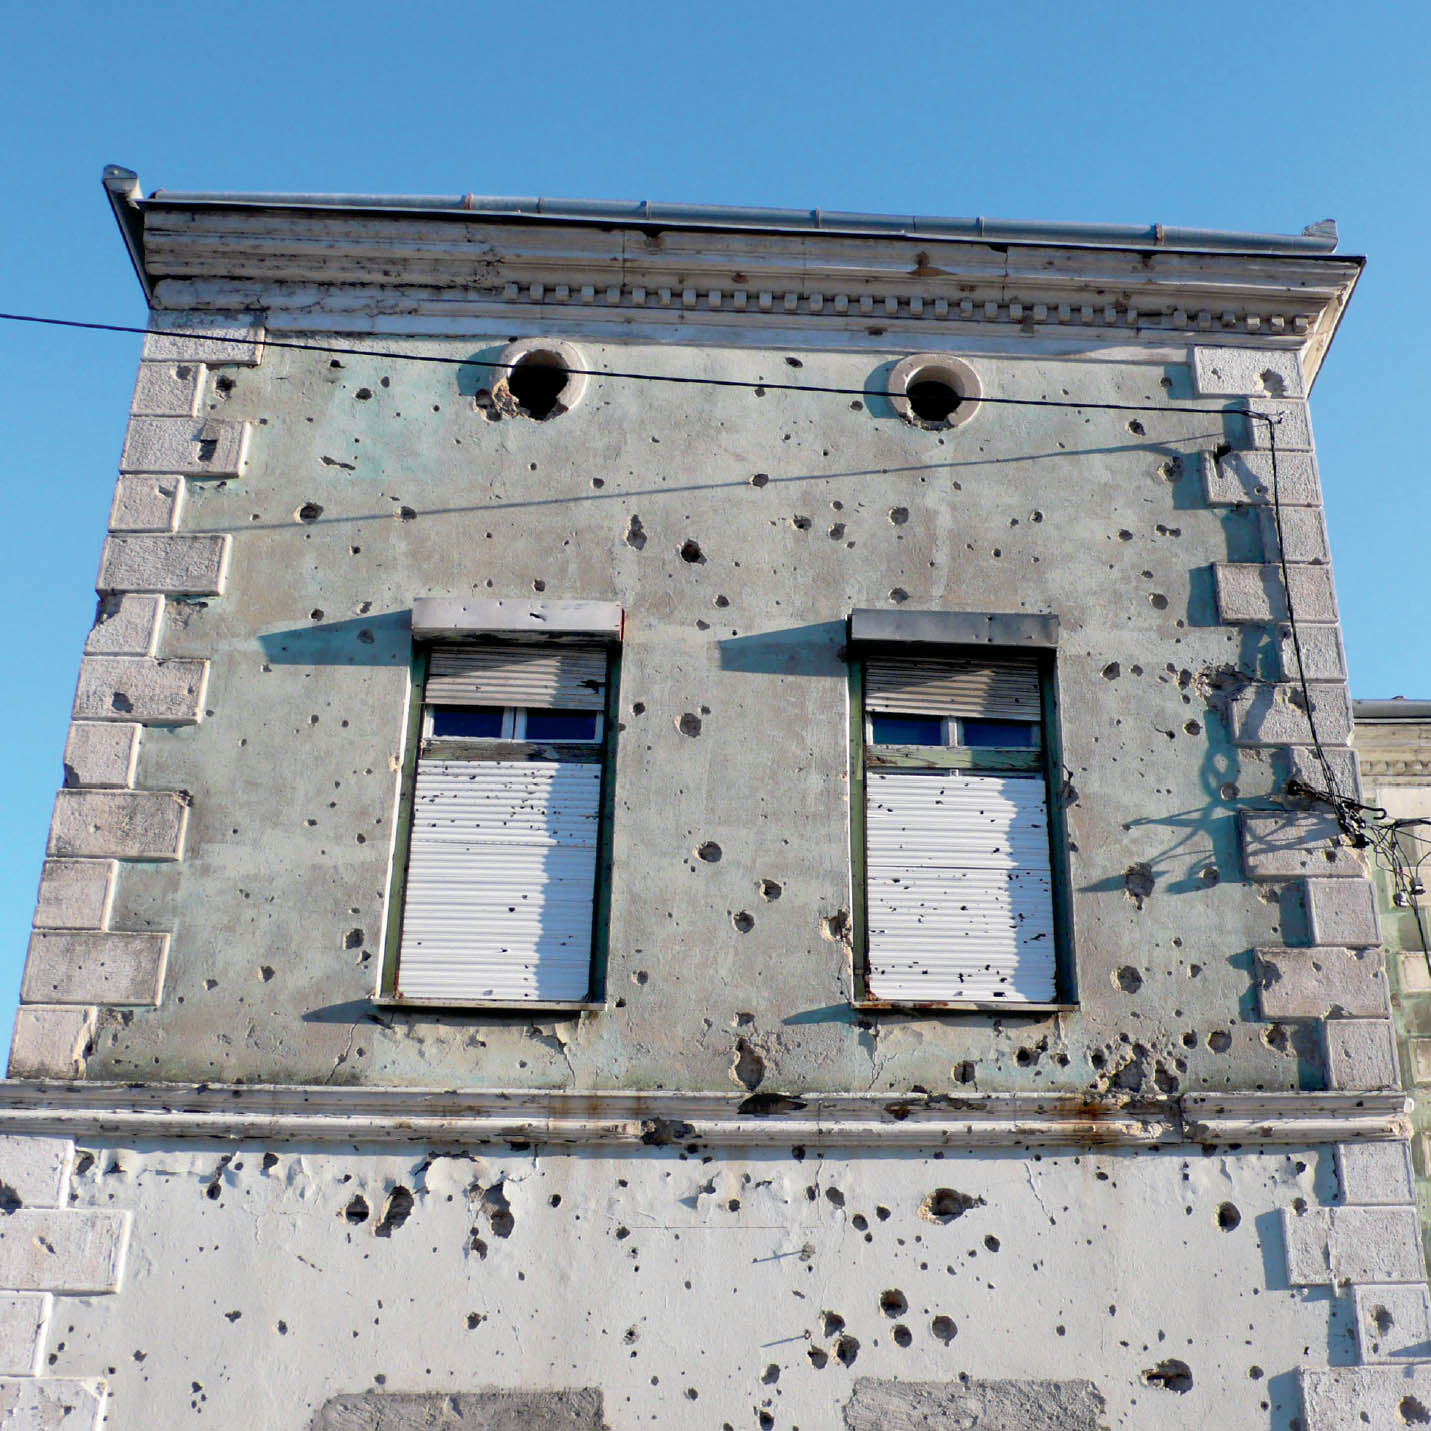
Destructive Points Never underestimate the power of a point. This damaged facade was photographed in the war-torn city of Mostar, on the Balkan Peninsula in Bosnia and Herzegovina. Nancy Froehlich.
![]()
Line
A line is an infinite series of points. Understood geometrically, a line has length, but no breadth. A line is the connection between two points, or it is the path of a moving point.
A line can be a positive mark or a negative gap. Lines appear at the edges of objects and where two planes meet.
Graphically, lines exist in many weights; the thickness and texture as well as the path of the mark determine its visual presence. Lines are drawn with a pen, pencil, brush, mouse, or digital code. They can be straight or curved, continuous or broken. When a line reaches a certain thickness, it becomes a plane. Lines multiply to describe volumes, planes, and textures.
A graph is a rising and falling line that describes change over time, as in a waveform charting a heart beat or an audio signal.
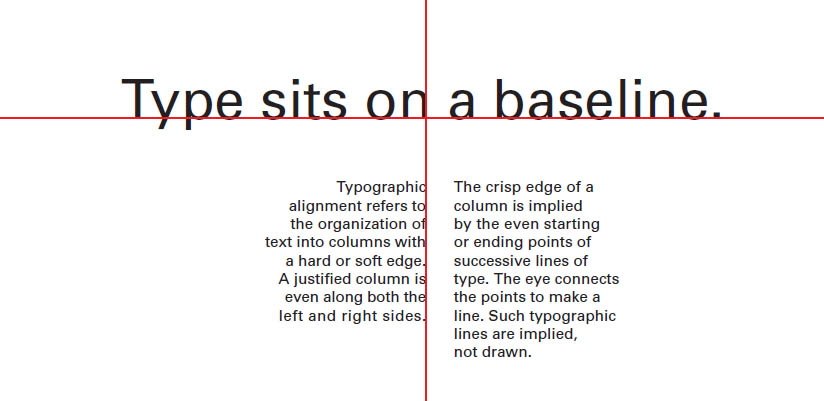
In typographic layouts, lines are implied as well as literally drawn. Characters group into lines of text, while columns are positioned in blocks that are flush left, flush right, and justified. Imaginary lines appear along the edges of each column, expressing the order of the page.
Jeremy Botts
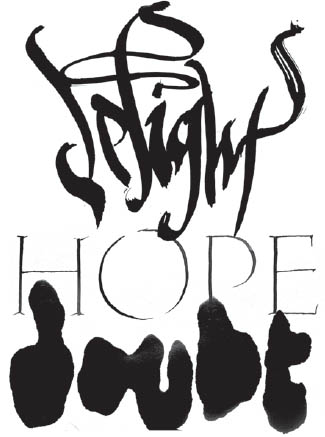
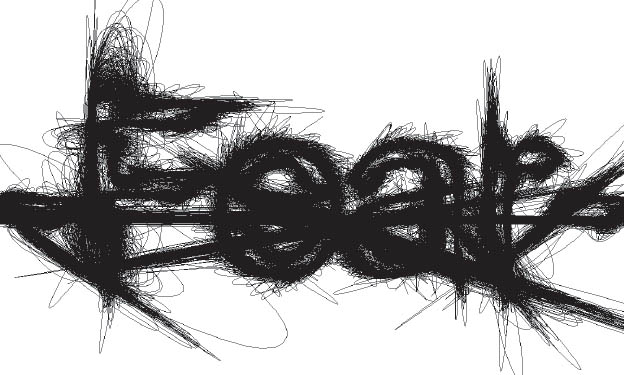
Lines express emotions.
Josh Sims Bryan McDonough
Alex Ebright Justin Lloyd
Digital Imaging. Nancy Froehlich, faculty.
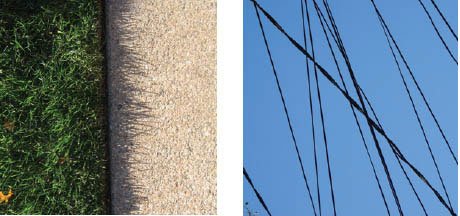
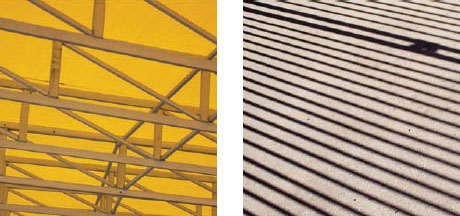
Lines describe structure and edges.
Allen Harrison
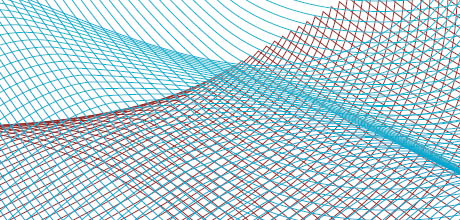
Lines turn and multiply to describe planes.
Line/Shape Study Vector-based software uses a closed line to define a shape. Here, new lines are formed by the intersection of shapes, creating a swelling form reminiscent of the path of a steel-point pen. Ryan Gladhill, MFA Studio.
Plane
A plane is a flat surface extending in height and width. A plane is the path of a moving line; it is a line with breadth. A line closes to become a shape, a bounded plane. Shapes are planes with edges. In vector-based software, every shape consists of line and fill. A plane can be parallel to the picture surface, or it can skew and recede into space. Ceilings, walls, floors, and windows are physical planes. A plane can be solid or perforated, opaque or transparent, textured or smooth.
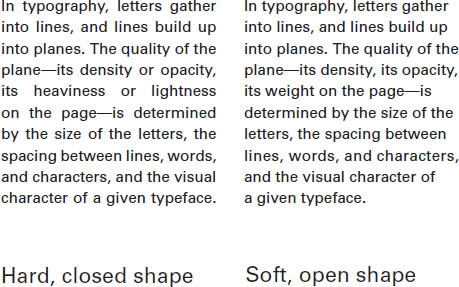
A field of text is a plane built from points and lines of type. A typographic plane can be dense or open, hard or soft. Designers experiment with line spacing, font size, and alignment to create different typographic shapes.
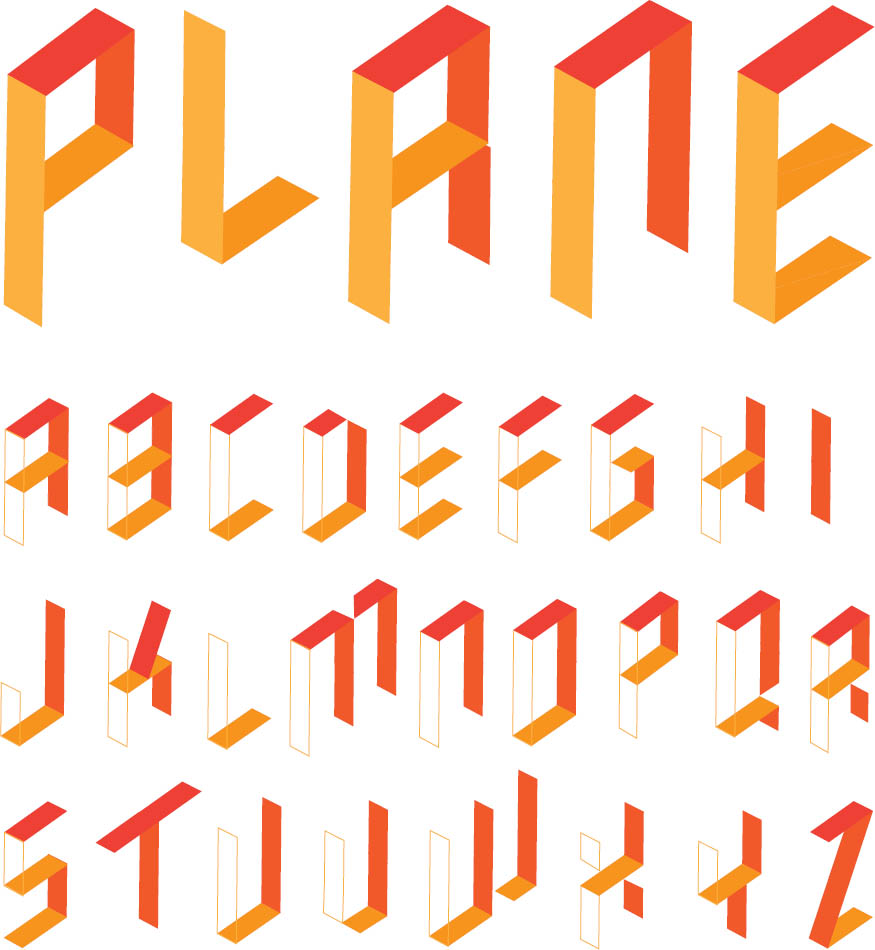
Plane Letters A plane can be described with lines or with fields of color. These letterforms use ribbons of color to describe spatial planes. Kelly Horigan, Experimental Typography. Ken Barber, faculty.

Parallel Lines Converge Summer Underwood
Space and Volume
A graphic object that encloses three-dimensional space has volume. It has height, width, and depth. A sheet of paper or a computer screen has no real depth, of course, so volume is represented through graphic conventions.
Linear perspective simulates optical distortions, making near objects appear large as far objects become small, receding into nothing as they reach the horizon. The angle at which elements recede reflects the position of the viewer. Are the objects above or below the viewer’s eye level? Camera lenses replicate the effects of linear perspective, recording the position of the camera’s eye.
Axonometric projections depict volume without making elements recede into space. The scale of elements thus remains consistent as objects move back into space. The result is more abstract and impersonal than linear perspective.
Architects often use axonometric projections in order to keep a consistent scale across the page. Digital game designers often use this technique as well, creating maps of simulated worlds rather than depicting experience from the ground.
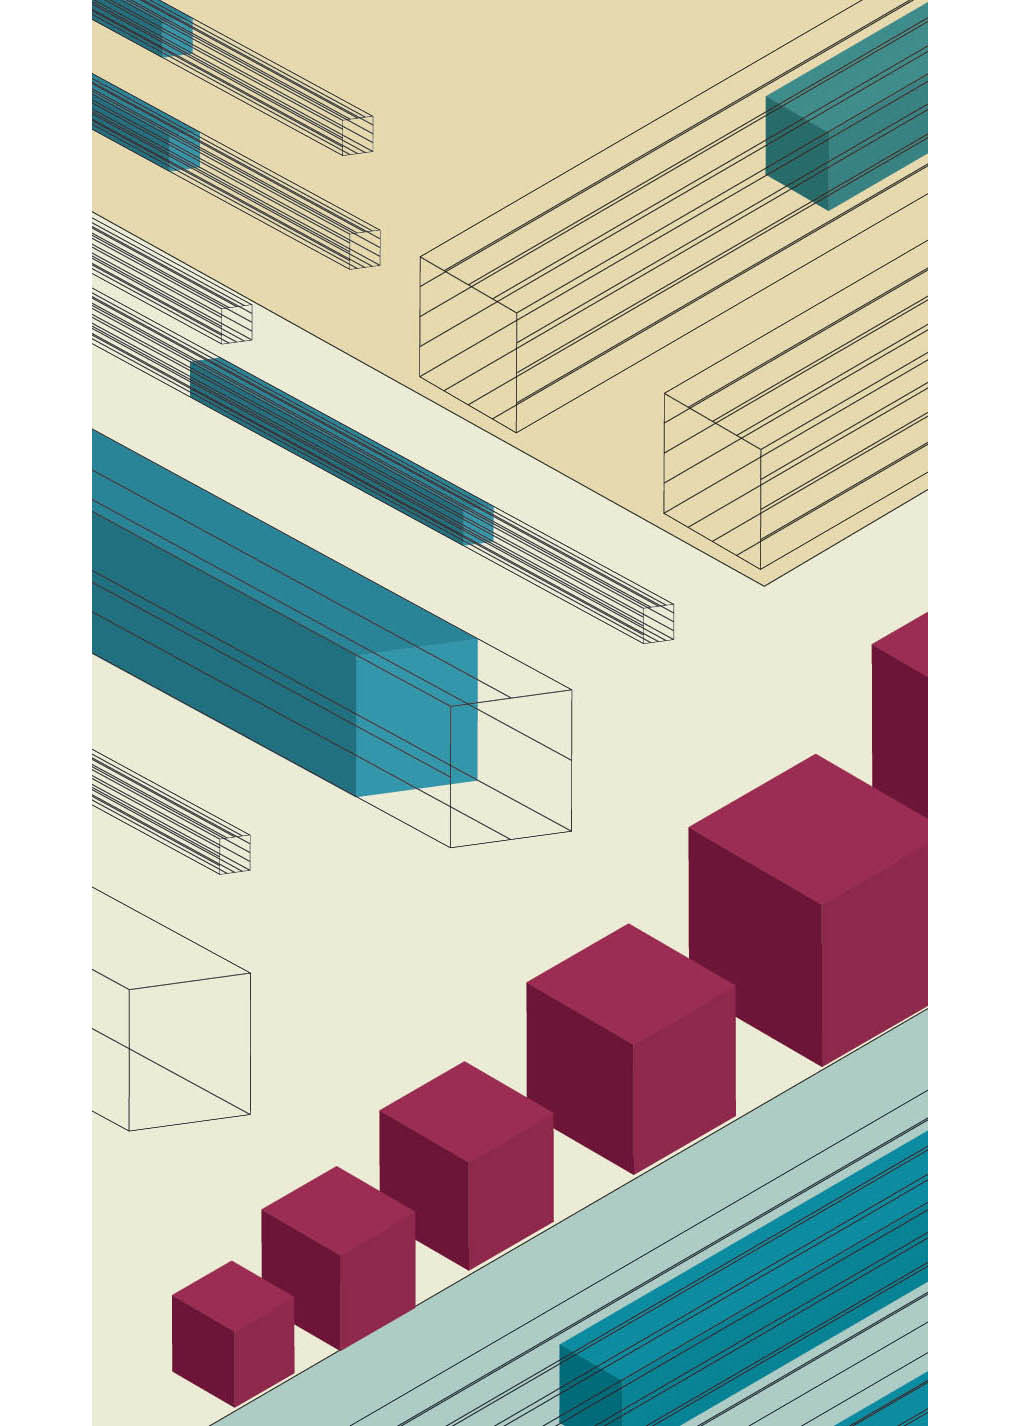
Projection Study This idealized landscape uses axonometric projection, in which scale is consistent from the front to back of the image. As seen on a map or computer game, this space implies a disembodied, godlike viewer rather than a physical eye positioned in relation to a horizon. Visakh Menon, MFA Studio.
Yeohyun Ahn
Visakh Menon
Gregory May
Yeohyun Ahn
Jason Okutake
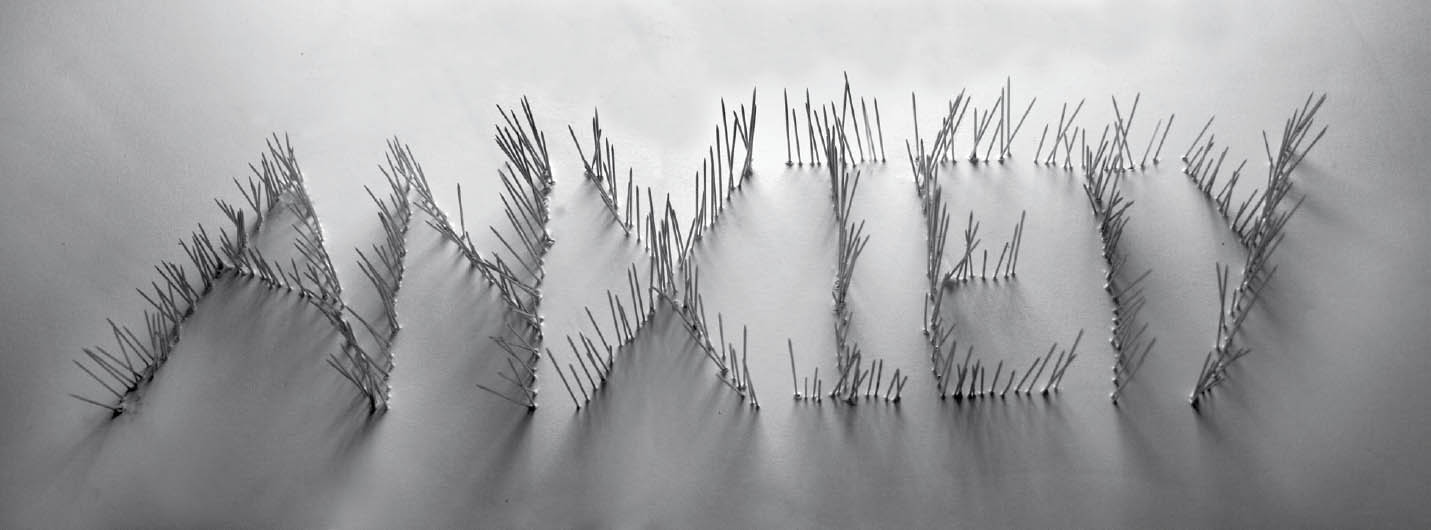
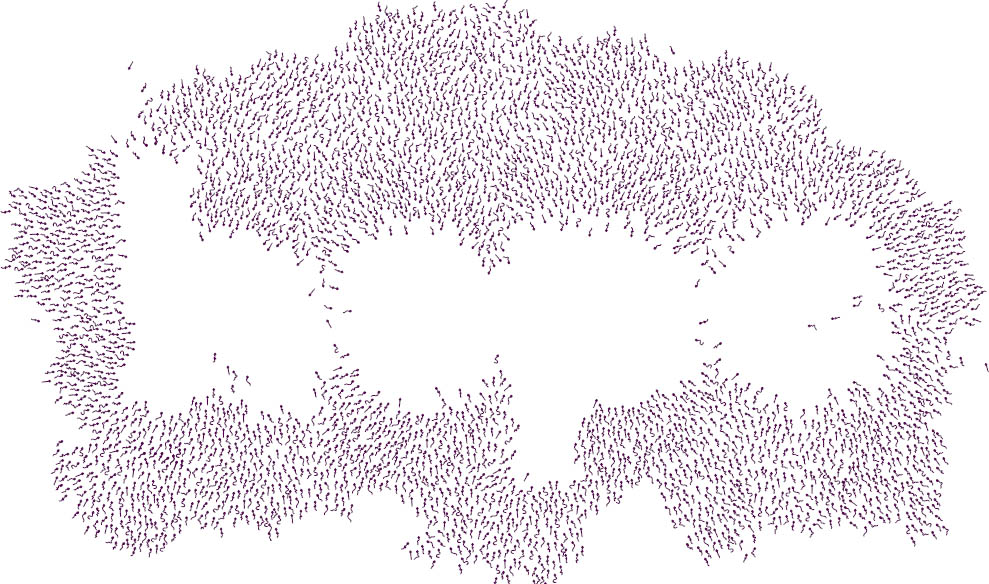
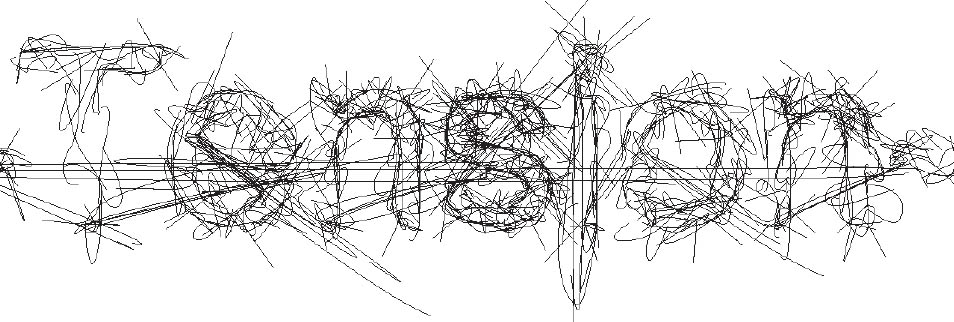
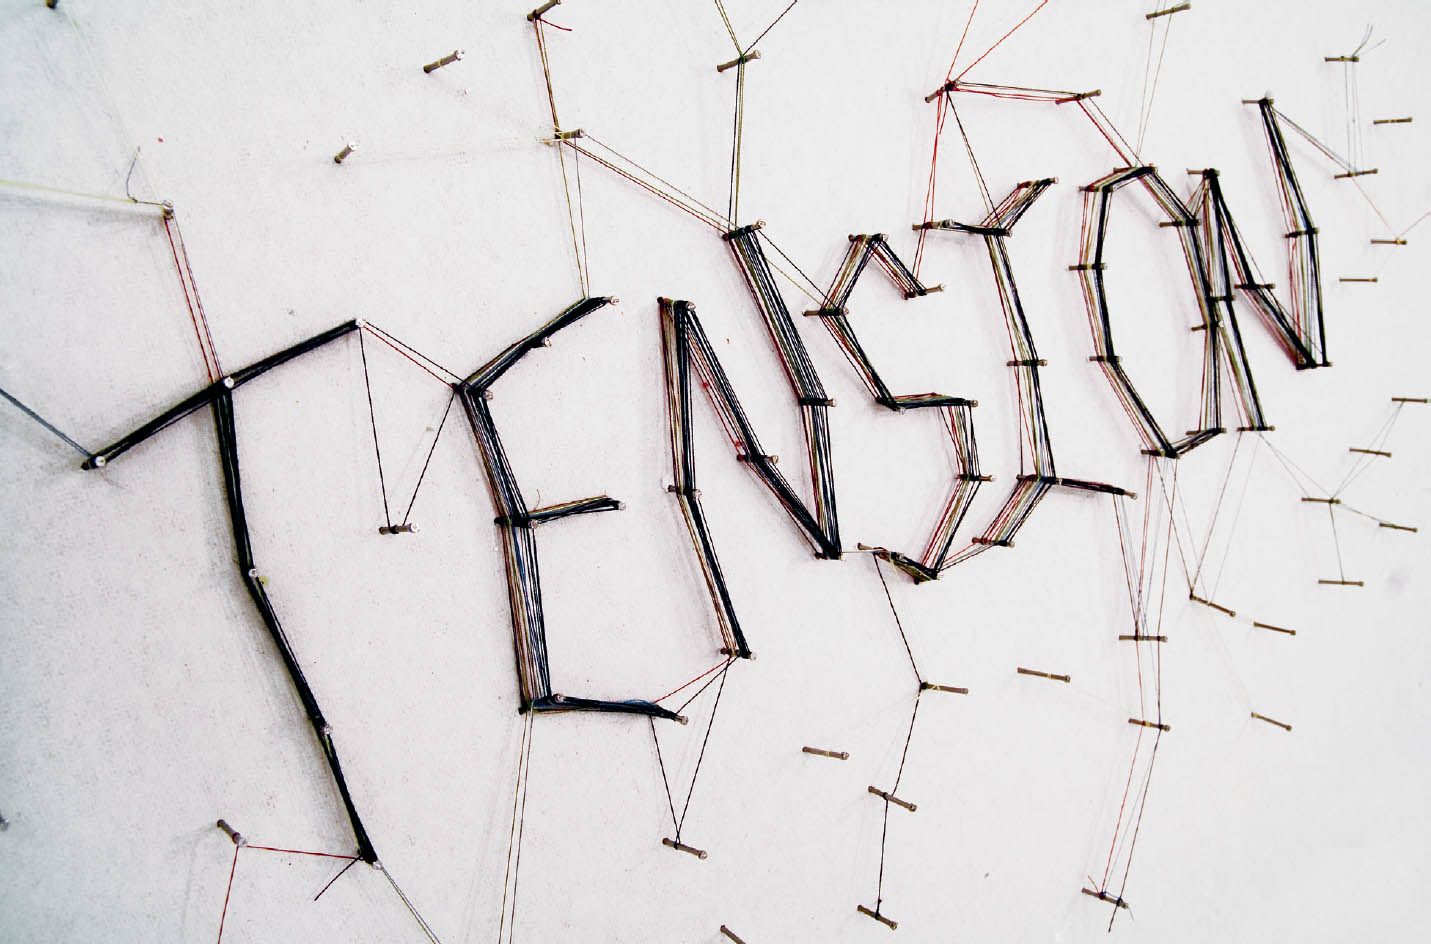
Point and Line: Physical and Digital In the lettering experiments shown here, each word is written with lines, points, or both, produced with physical elements, digital illustrations, or code-generated vectors. MFA Studio. Marian Bantjes, visiting faculty.
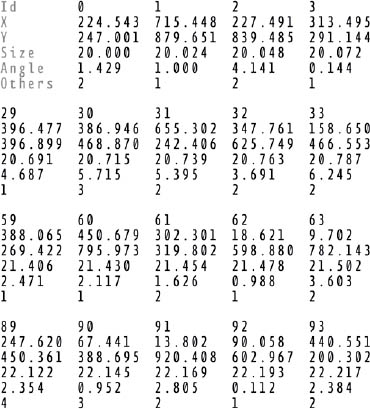
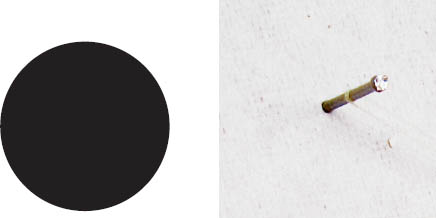
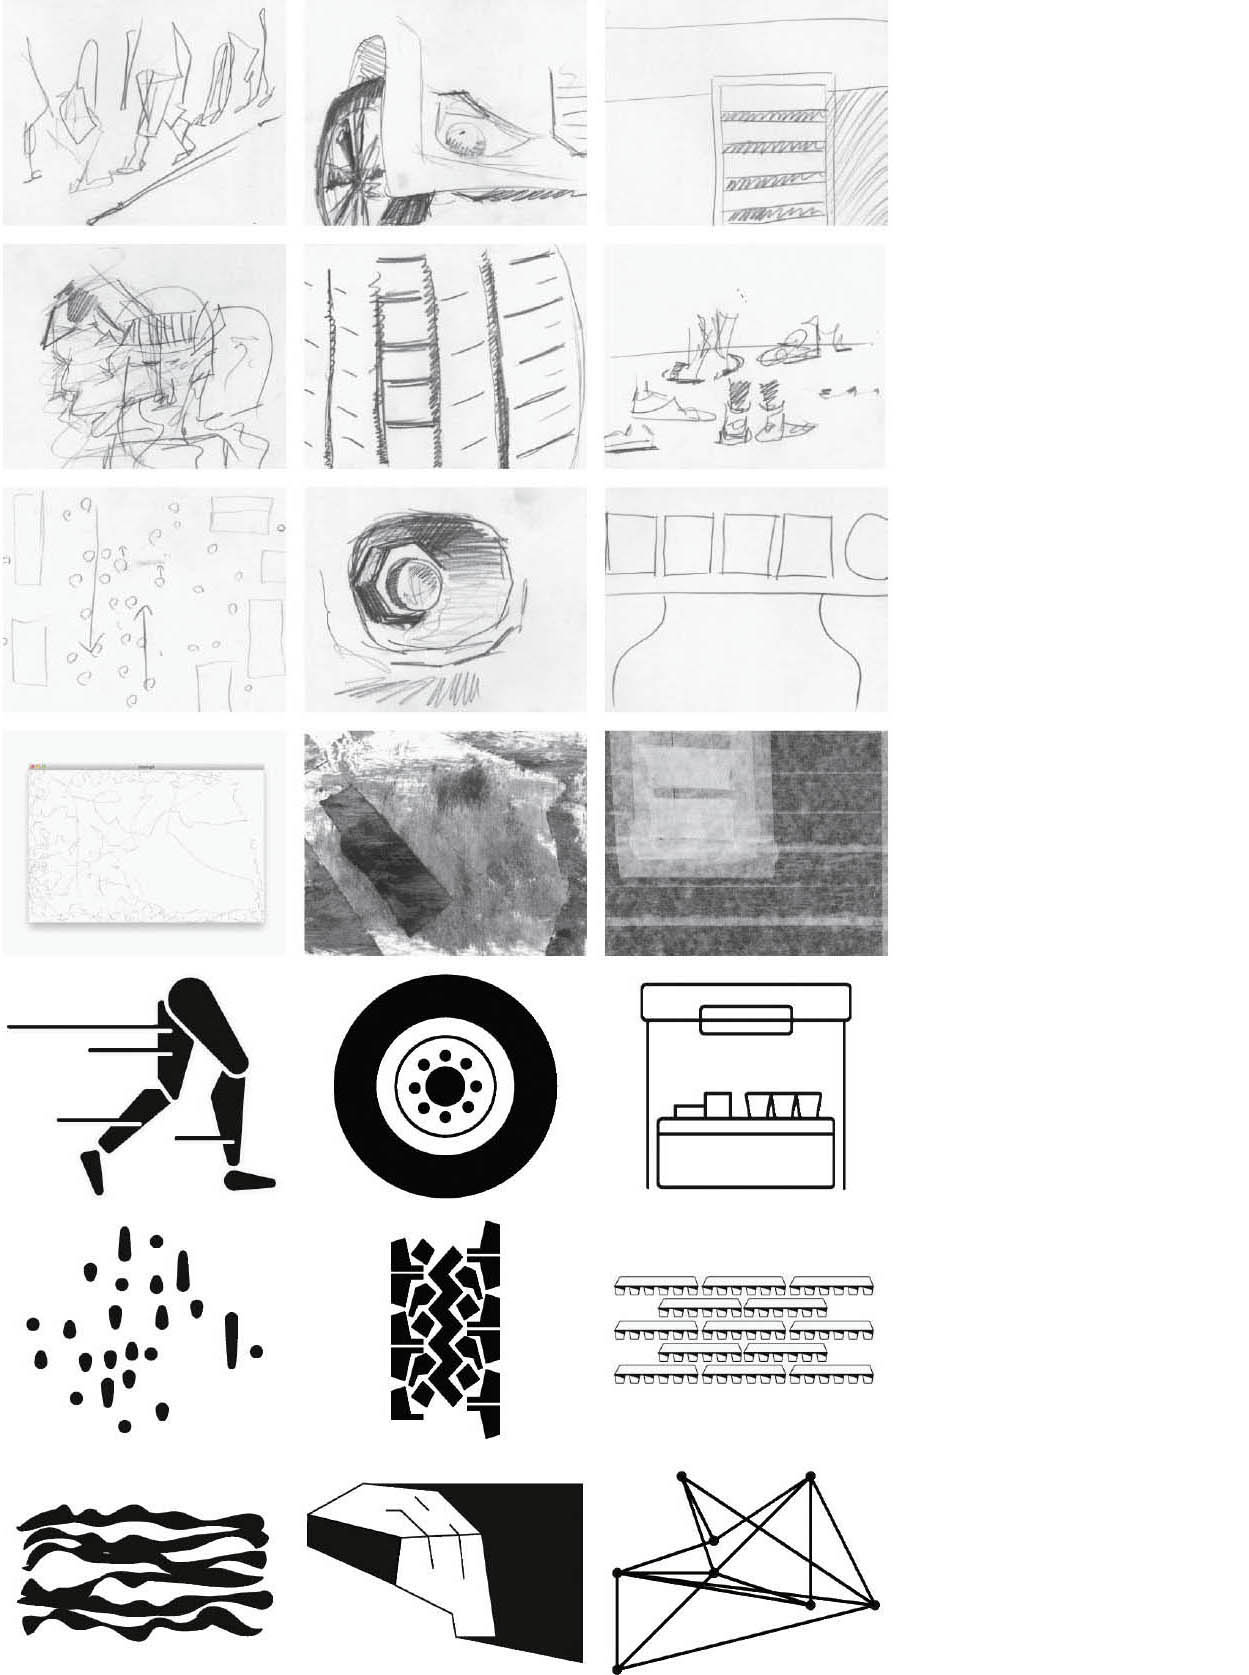
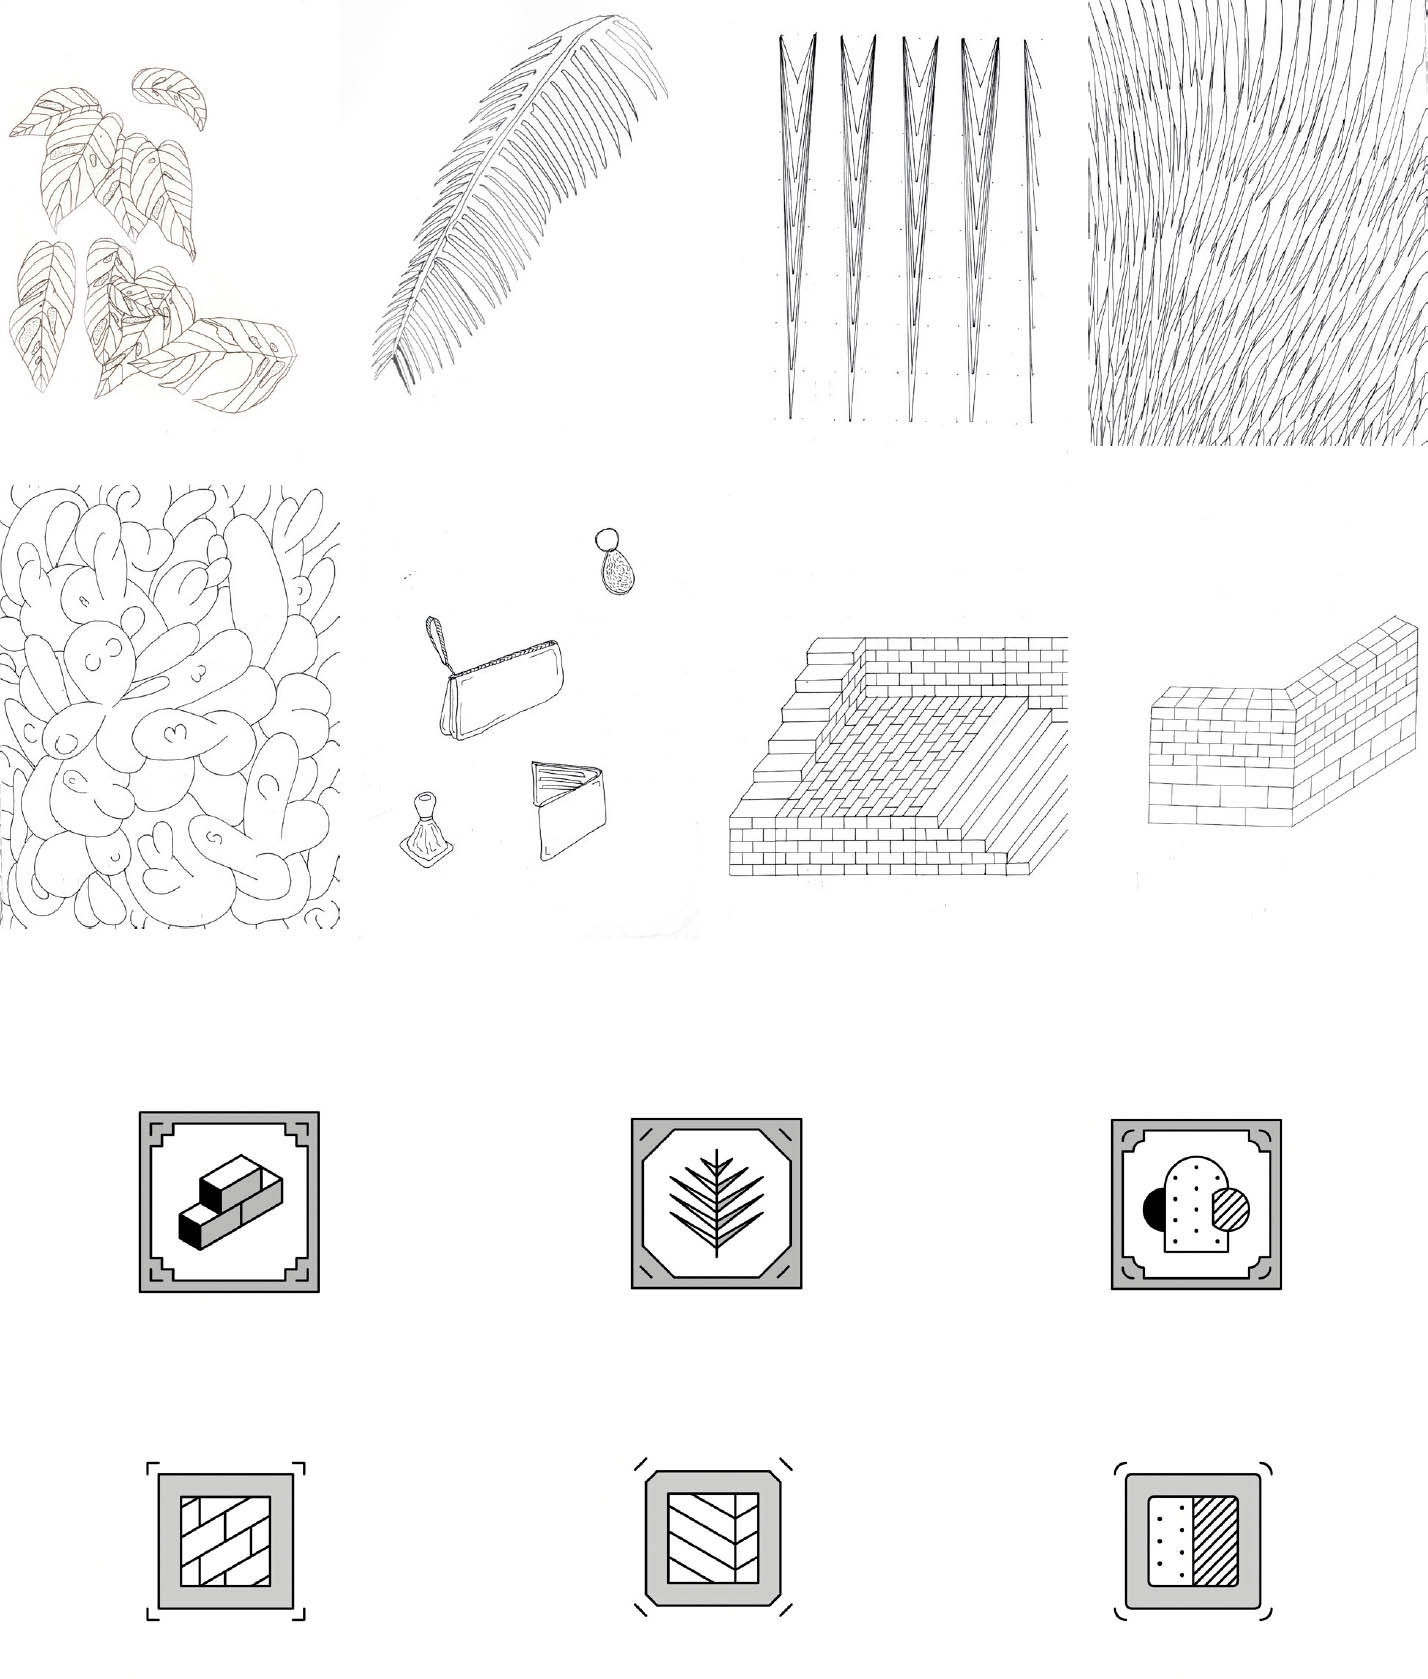
Three Objects, Thirty-Three Ways
This comprehensive design project encourages designers to observe, represent, and abstract visible objects using a variety of materials and techniques. Designers begin by visiting an unusual place with surprising things to see and observe, such as a local museum, aquarium, or botanical garden. They produce a substantial number of observational drawings of three objects, paying special attention to the appearance of form, color, texture, and materials. Careful observation is followed by exercises in creating word lists and drawing from memory to create a total of ninety-nine studies. The project exposes designers to the iterative design process, building individual capacity for patience, endurance, and an open mind. Graphic Design I. Brockett Horne, faculty.
Trevor Carr
Michael Quednau
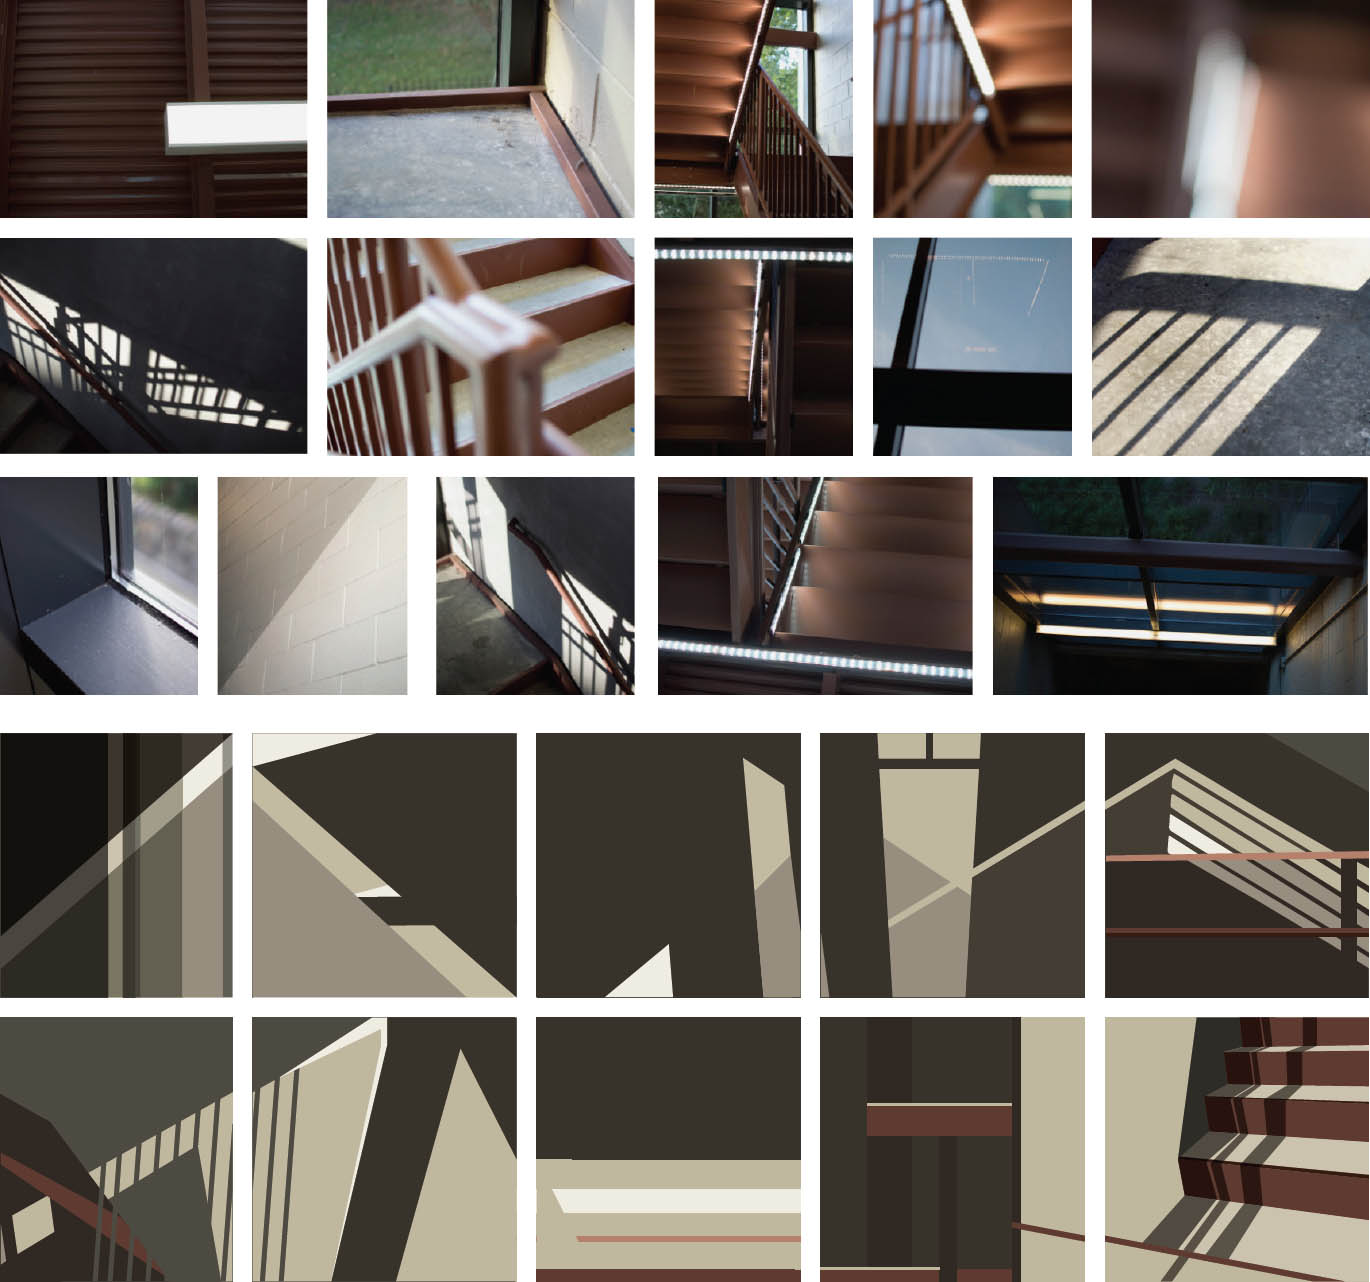
Spatial Translation
In this project, designers explore point, line, and plane as tools for expression. They immerse themselves in a space and observe it from multiple points of view, including different vantage points (above, below) and different psychological orientations (as a male, a female, a giraffe, a shrimp, etc.). Participants generate images of their chosen spaces in diverse media, including photography, drawing, painting, printing, collage, or video. Representations can be literal, abstract, iconic, indexical, or symbolic. After gathering their initial observations, designers create a series of representations using dot stickers, tape, and cut paper. The final application is a sequence of ten images suitable for an accordion fold book. Graphic Design I. Brockett Horne, faculty.
Jen Evans
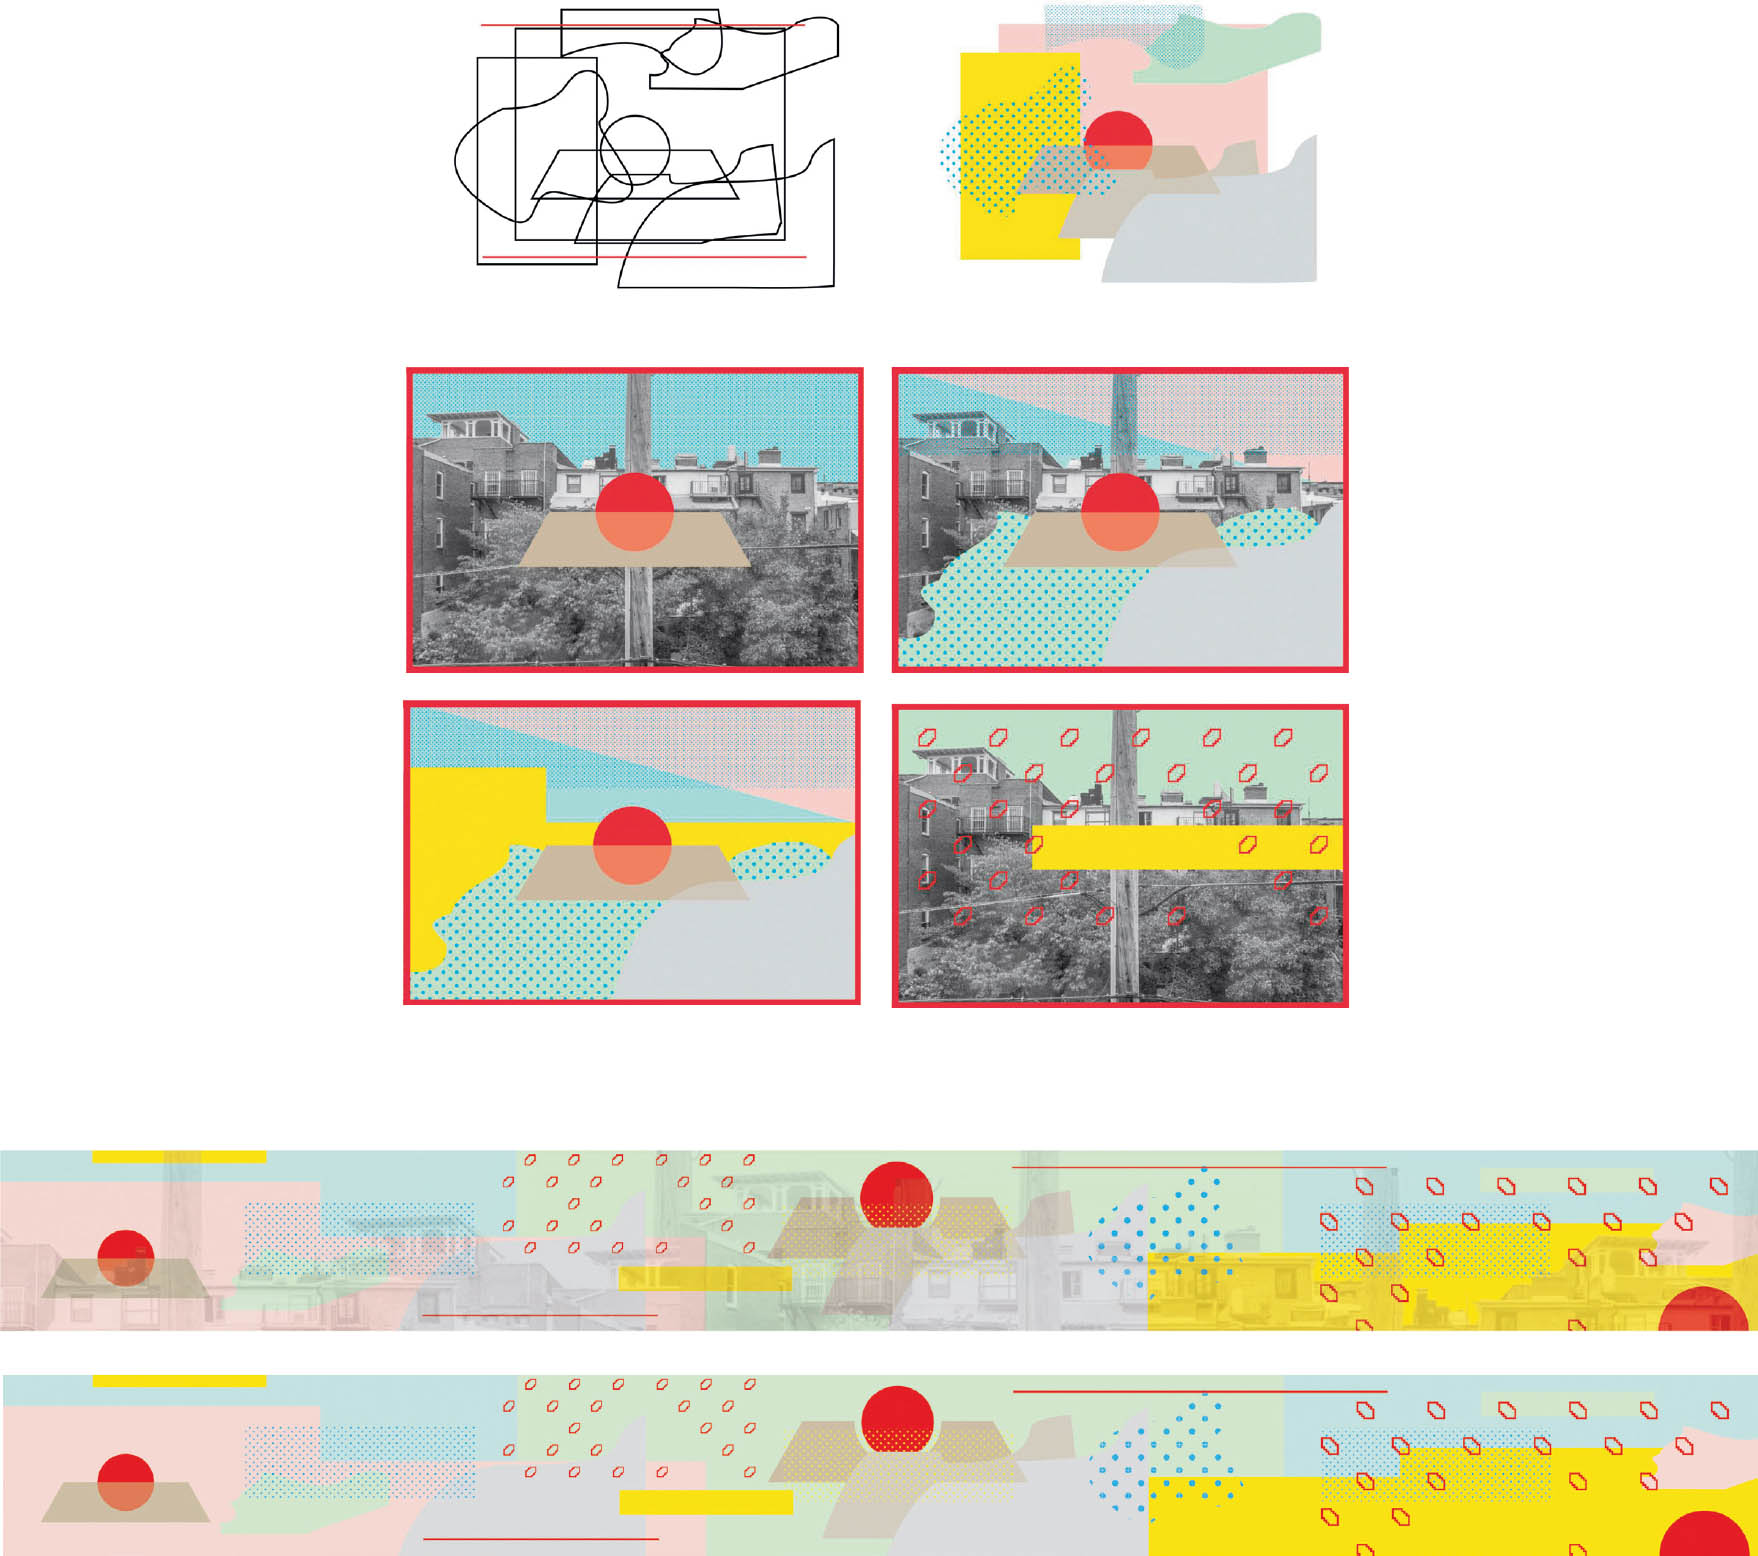
Michael Quednau
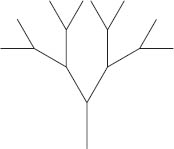
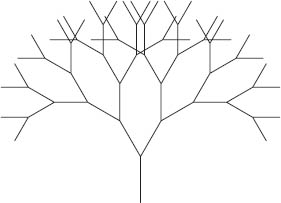
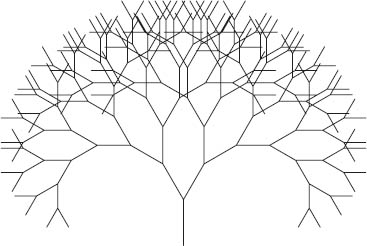
Drawing with Code
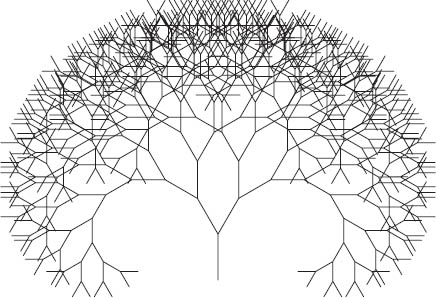
The drawings shown here were created with Processing, an open-source software application. The designs are built from a binary tree, a basic data structure in which each node spawns at most two offspring. Binary trees are used to organize information hierarchies, and they often take a graphical form. The density of the final drawing depends on the angle between the “children” and the number of generations.
The larger design is created by repeating, rotating, inverting, connecting, and overlapping the tree forms. In code-based drawing, the designer varies the results by changing the inputs to the algorithm.
![]()
BinaryTree(400,600,400,550,30,1);
BinaryTree(400,600,400,550,30,3);
BinaryTree(400,600,400,550,30,5);
BinaryTree(400,600,400,550,30,7);
BinaryTree(400,600,400,550,30,9);
Binary Tree The drawing becomes denser with each generation. The last number in the code indicates the number of iterations. Yeohyun Ahn, MFA Studio.
Bézier Curves
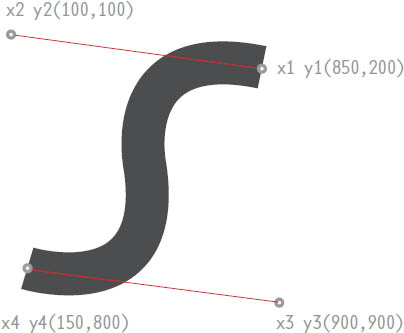
A Bézier curve is a line defined by a set of anchor and control points. Designers are accustomed to drawing curves using vector-based software and then modifying the curve by adding, subtracting, and repositioning the anchor and control points.
The drawings shown here were created with the open-source software application Processing. The curves were drawn directly in code:
bezier(x1,y1,x2,y2,x3,y3,x4,y4);
The first two parameters (x1, y1) specify the first anchor point, and the last two parameters (x4, y4) specify the other anchor point. The middle parameters locate the control points that define the curve.
Curves drawn with standard illustration software are fundamentally the same as curves drawn in code, but we understand and control them with different means. The designer varies the results by changing the inputs to the algorithm.
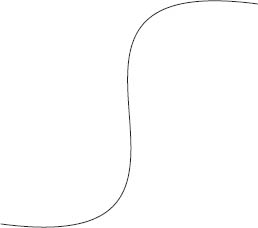
bezier(850,200,100,100,900,900,150,800);
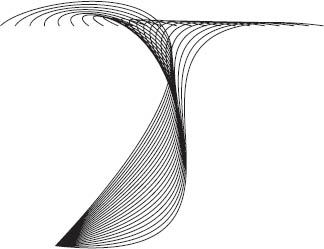
for(int i=0;i<900; i=i+40)
{bezier(i,200,100,100,900,i,150,800);}
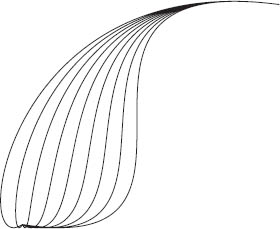
for(int i=0; i<900; i=i+100)
{bezier(850,200,100,100,i,900,150,800);}
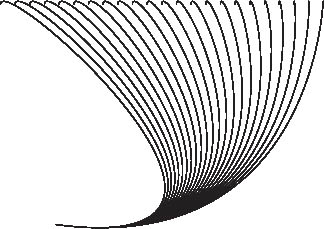
for(int i=0;i<900;i=i+40)
{bezier(i,200,i,100,900,900,150,800);}
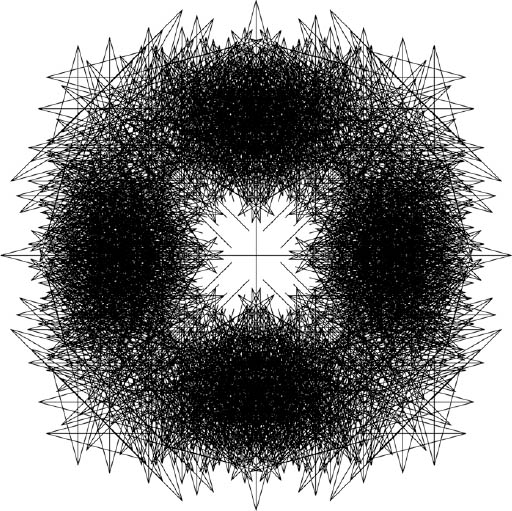
Repeated Bézier Curve The designer has written a function that repeats the curve in space according to a given increment (i). The same basic code was used to generate all the drawings shown above, with varied inputs for the anchor and control points. A variable (i) defines the curve. Yeohyun Ahn, MFA Studio.
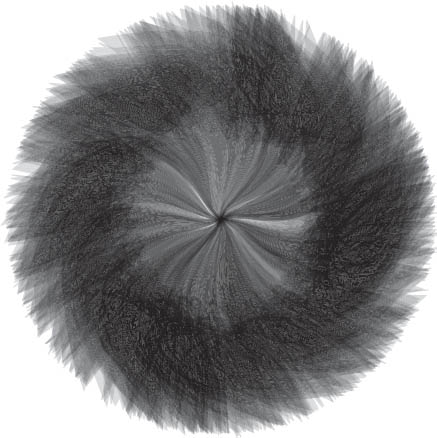
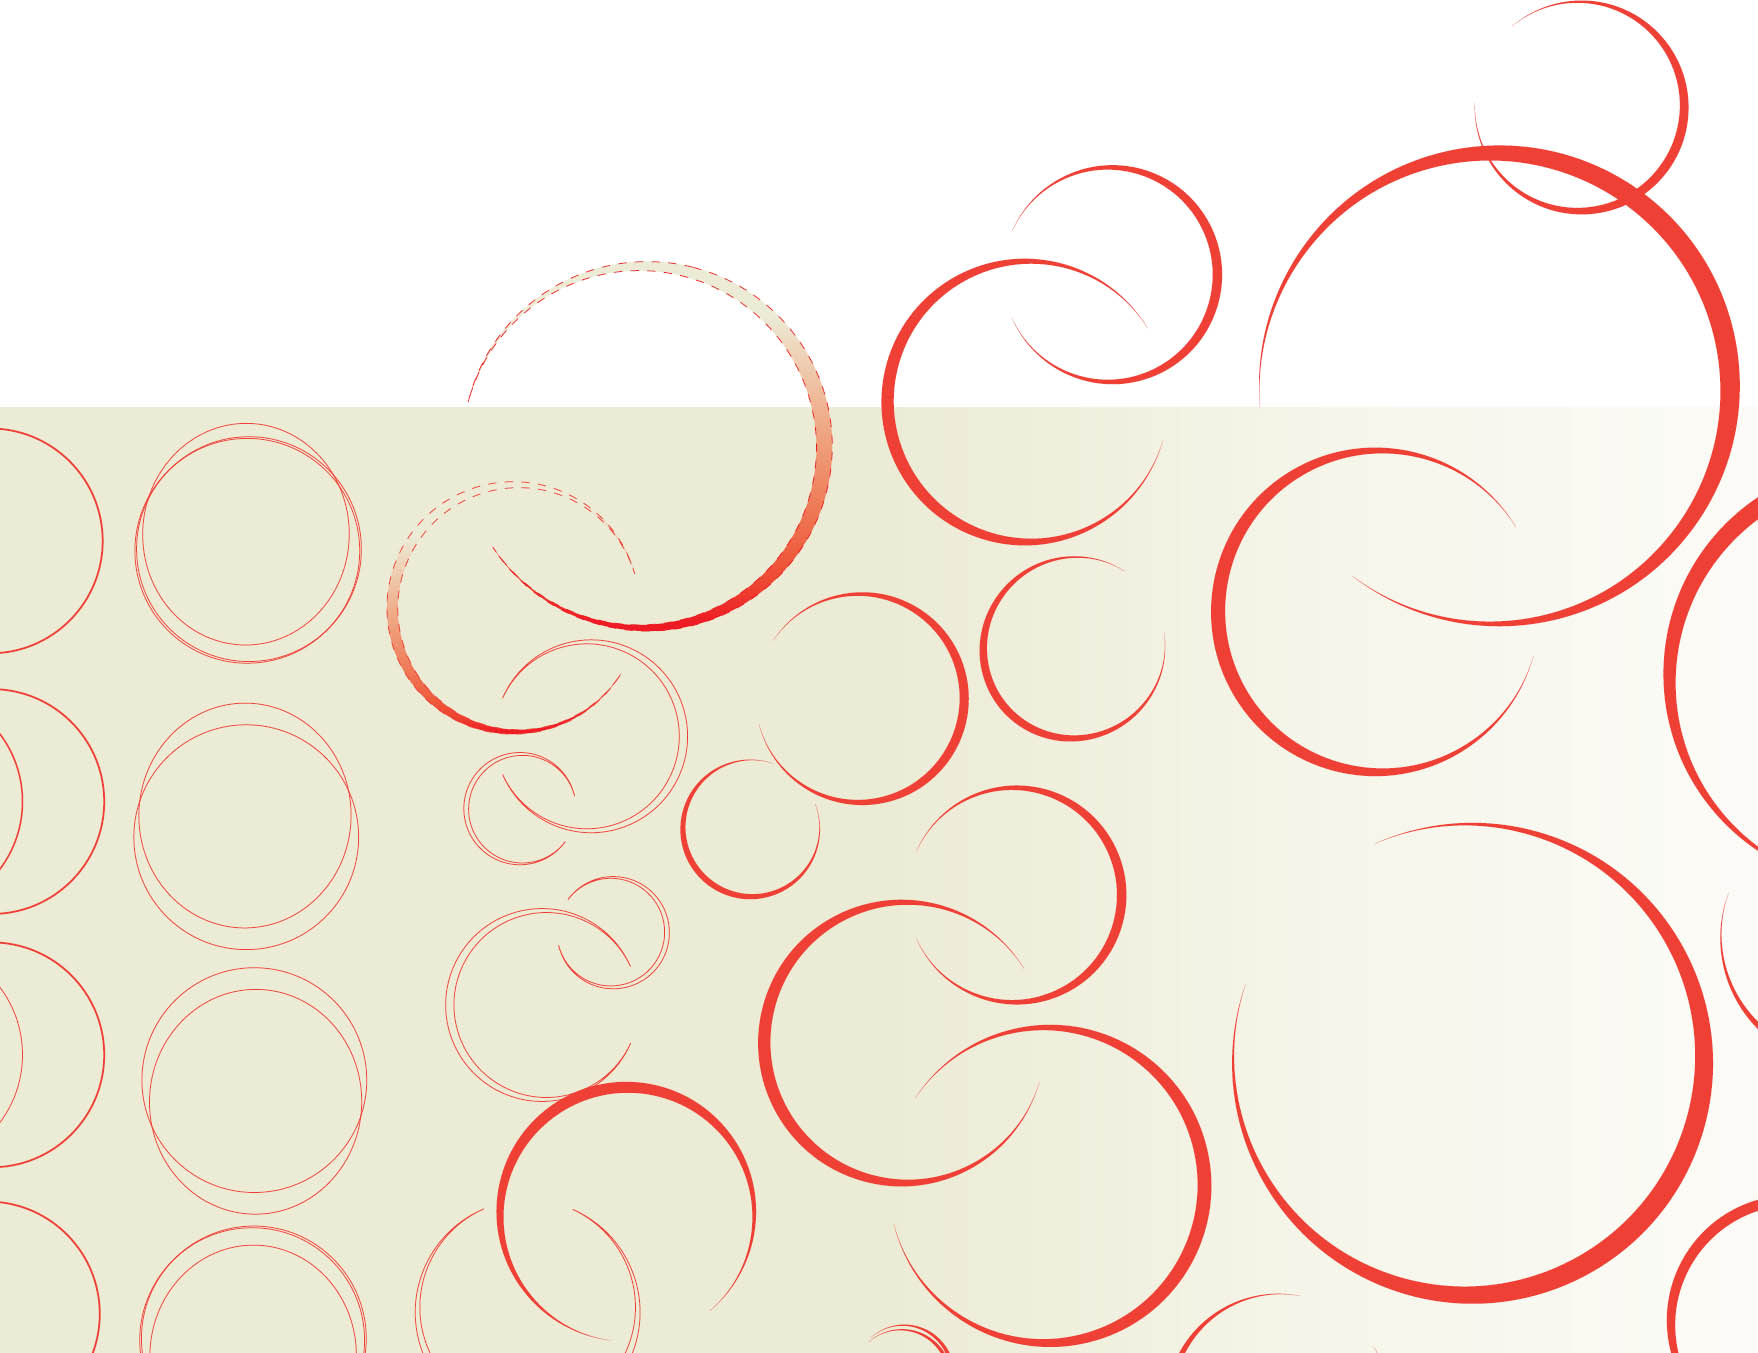
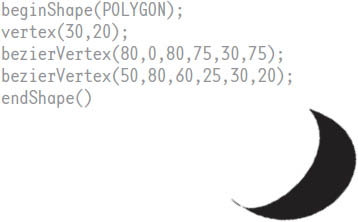
Black Flower A Bézier vertex is a shape created by closing a Bézier curve. This design was created by rotating numerous Bézier vertices around a common center, with varying degrees of transparency. Yeohyun Ahn, MFA Studio.
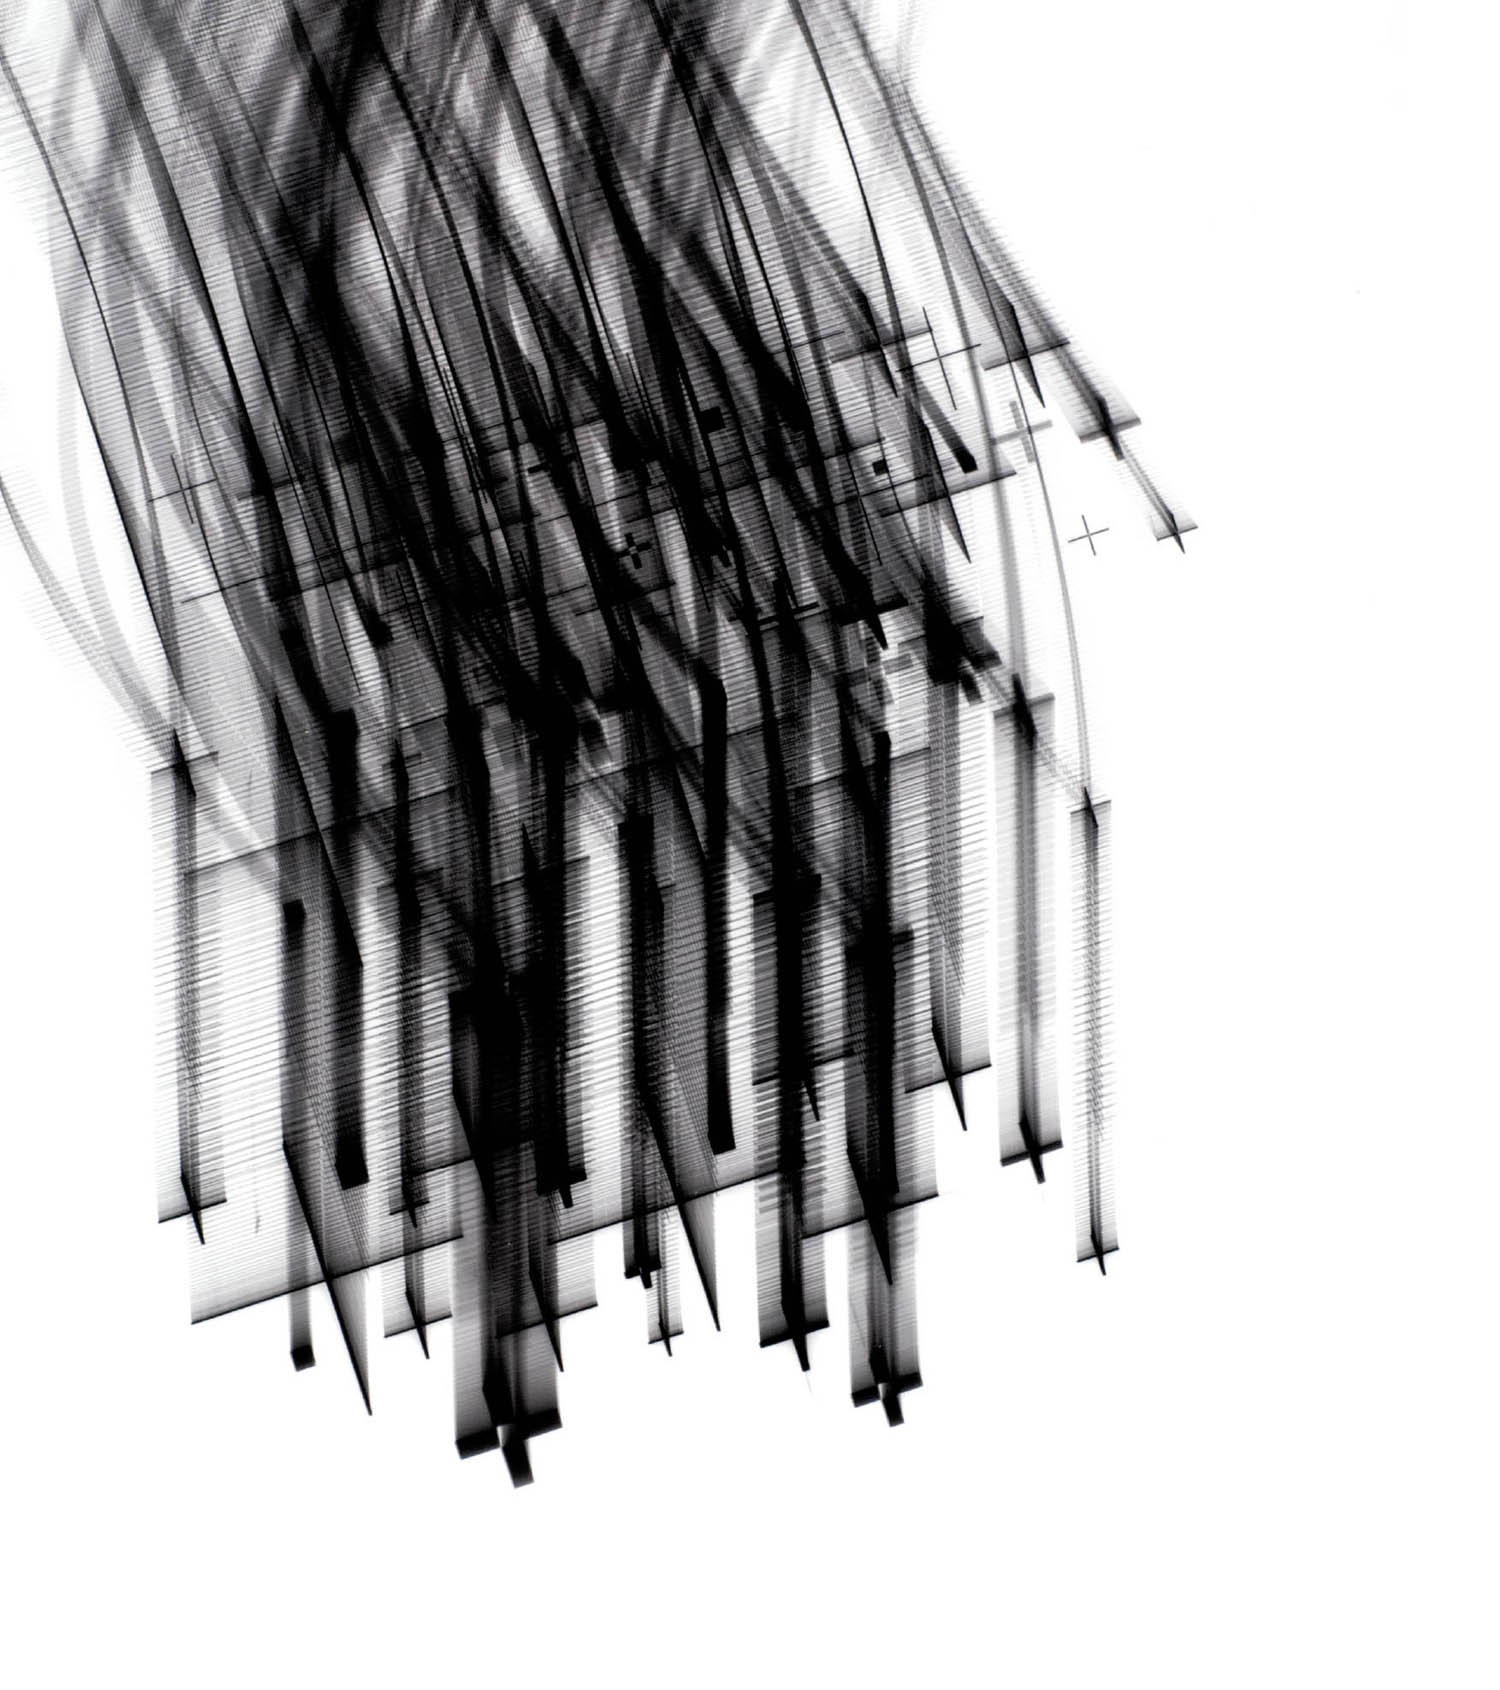
Rhythm and Repetition This code-driven photogram employs a simple stencil plus sign through which light is projected as the photo paper shifts minutely and mechanically across the span of hours. The visual result has the densely layered richness of a charcoal drawing. Tad Takano. Photographed for reproduction by Dan Meyers.