The Art of Digital Marketing: The Definitive Guide to Creating Strategic, Targeted, and Measurable Online Campaigns - Ian Dodson (2016)
Chapter 9. ANALYTICS
An Introduction
Generally perceived as complex, dry, and scarily overwhelming, analytics does not have the most exciting reputation. Whilst it might give you sweaty palms, a racing heart, and keep you up all night panting breathlessly, it's for all the wrong reasons.
So let's look instead at what is sexy. Success. Slick marketing. Competitive advantage. Profit.
And how are these glorious things achieved? With killer insights, clues dug out of the data like rough diamonds, and wisdom polished into precise actions. Knowledge is power, after all, and analytics really brings the heat in that department! So whilst stats might not appear sexy, what can be done with them is, and this is the seductive beauty of analytics.
However, this beauty is somewhat buried. It's our job to see beyond analytics' intimidating exterior and focus on digging out the internal wisdom. Because if the inner workings of analytics can be understood, and the power of the insights gained can be optimized to meet specific needs, then a whole world of knowledge-based clarity will open up, achieving those sexy items outlined above!
Formal definition of analytics: The process of measuring, collecting, analyzing, and reporting the behavior of visitors on a website, in order to understand and optimize web usage.
Informal definition of analytics: What's the story behind the stats? (And it's a never-ending one.)
The online world shifts constantly, so analytics continually monitors and evaluates website traffic, forever asking: What is working, what isn't, why, and what are we doing about it?
It's a myth that analytics is just about data—it's actually more about reading between the lines to interpret that data. The challenge is to customize each report for specific needs, then dig out insights that help to optimize the site, understand the users, and meet business aims.
Process
In this chapter, you will explore the four key stages of the ongoing analytics process, as shown in Figure 9.1.
1. Goals. The process begins by setting goals for both the business and the website, then specifying how analytics will be used to help measure those goals. Analytics is about the who, what, when, how many, and why: This is the stage at which those questions are defined, the rationale behind them explored, and the answers to them discovered.
2. Setup. Here the groundwork is laid for answering the questions asked when setting your goals and for meeting those goals—by setting up a Google Analytics (GA) account and configuring it as needed. A solid working knowledge of GA and related tools is required for this. Once the structure and utility of GA is understood, as well as what levels of access and permissions are required, then the interface and reporting on goals can be organized.
3. Monitor. This stage involves top-level monitoring of audiences, traffic sources, and campaigns, as well as a critique of site performance. Having statistical context from the previous stages, the goals from stage 1 can now be refined further as preparation for diving into even deeper analysis.
4. Analyze. This stage is incredibly data rich! It is both the beginning and the end of the cycle, the stage at which in-depth analysis is performed, targeted insights developed, business goals and strategy tweaked, and the reporting process started anew. This is the stage for studying to what extent KPIs and goals were met, for answering why or why not they were, and for making informed decisions to improve weak areas and to capitalize on strong ones.
Figure 9.1 Four-Stage Analytics Process
Key Terms and Concepts
This chapter will teach you how to measure, monitor, and optimize your digital marketing activity using analytics. Here's what you will understand upon completion:
· Why businesses should adopt a formal analytics program.
· Which tools are available to measure and monitor online traffic.
· How to build standard, scheduled, and customized reports.
· How to set up accounts, profiles, permissions, and tracking codes.
· How to use GA to profile audiences and assess technical performance.
· How to measure engagement and conversion by tracking activities.
· The relationship between business KPIs and analytics goals.
Stage 1: Goals
Welcome to stage 1 of the analytics process, which is highlighted in Figure 9.2 and where you will learn how to set goals for both your business and website, and in turn, define how Google Analytics (GA) will be used to help measure those goals.
Figure 9.2 Focus on the First Stage in the Analytics Process
A smart digital marketing strategy provides you with the opportunity to achieve visibility in your brand and to excite potential customers. Being able to analyze your online activity, from creating content right through to serving ads, is critical to iterating its success.
However, digital professionals can sometimes find the effectiveness of their marketing difficult to measure, especially if there's an underlying uncertainty about its role within your overall digital marketing strategy.
If you want to be a successful digital marketer, you need to get existential: Before you start analyzing your online activities, ask yourself one simple question—what are you trying to find out? It's important to remember that in order to measure your success, metrics should always be aligned with your goals. You need to start by defining your objectives in using GA, some of which could include analyzing data in order to:
· Find out who your target audience is.
· Increase brand awareness and advocacy.
· Drive website traffic.
· Discover which areas of your site are causing high bounce rates.
· Increase lead generation and nurturing.
· Improve customer retention.
· Enhance upselling.
· Increase sales.
A very common reason why many digital marketing strategies fail is also an incredibly simple one—a failure to analyze the data. It might not seem like something worth spending time on, but if you give yourself the chance to really think about and identify your goals and overarching strategy you will be able to make much more informed decisions about how to use data to increase your digital marketing efforts.
Key Concepts
Before beginning, let's get familiar with some of the key concepts that will be covered in this chapter.
1. Dimensions and metrics. Dimensions describe data, whereas metrics measure data. For example, users is a dimension, and its measurement metric is the number of logged-in users. Studying both is what creates insight.
2. Cookies. Cookies are files exchanged between a web browser and a server that differentiate users. They track repeat views versus unique users (different visitors) without collecting personal data (no names, etc.). Cookies last 60 days, meaning one user would be counted as unique for this time period.
3. Data protection. All analytics services have to comply with data protection guidelines, which means not collecting personal data. Pay attention to local regulations, because not every country operates in the same way.
Key Terms
Next we introduce some key terms.
1. Session. A group of interactions that take place during a given time frame. For example, several different page views by the same unique user in the same window of time would be counted as one session.
2. Users. The number of nonduplicated users. If the user clears his cookies, he will be counted again.
3. Pages per session. The average number of page views that a person completed before exiting the site.
4. Average session duration. The average amount of time the user spent on the site. This is reported in minutes in GA, and in seconds in Google AdWords.
5. Percentage of new sessions. An estimate of the percentage of first-time visits.
6. Conversion. A completed activity that contributes to the success of the business. This could be represented by a range of different things; for example, a sale, or signing up for a newsletter.
7. Goal. A defined conversion, allowing measurement of the number of times that conversion was completed. There can be many different goals, and they are put in place to track performance.
8. Conversion rate. The rate at which users actually completed the goal or the transaction on your site.
9. Transaction. Different from a goal, this is a revenue metric. An e-commerce tracking function can be installed to track transactions.
10.Annotations. Notes (public or private) manually added to data that provide context; for example, elaborating on a spike in traffic by adding details about a related offline marketing activity.
Stage 2: Setup
To kick off our analytics module, let's examine the world's most widely used analytics tool: Google Analytics. GA has been referenced throughout this course, specifically tying in with the SEO, PPC, and social media modules, so let's dive into an examination of how it works.
This section is concerned with the second stage in the analytics process (highlighted in Figure 9.3), or setting up a GA account. Once you have finished it you will understand:
· The benefits of GA compared to other tools.
· The structure of GA and its varying access levels.
· How to set up a GA account and navigate its interface.
· Which types of reports can be pulled.
Figure 9.3 Focus on the Second Stage in the Analytics Process
GA Overview
GA operates a constant system of collection, measurement, and analysis of website data.
Technically speaking, this works in the following way:
1. When setting up GA, a code is provided that must be inserted into your website.
2. When that webpage is displayed to a user, the analytics code drops cookies.
3. Cookies (which track users) are dropped, and data is communicated back to GA.
4. This data is processed in the GA backend then presented in the interface.
Why GA?
There are other analytics tools on the market, but GA perks are difficult to beat:
· Free.
· Industry standard, used by 98 percent of brands.
· Simple to use for most e-commerce platforms and websites.
· Highly customizable for specific business/campaign needs.
· Integrates nicely with other Google products (e.g., AdWords and Webmaster).
· Extensive online support and tutorials.
Free versus Paid
There is also a paid version of GA, called Universal Analytics, which offers greater functionality and more in-depth reporting. It is used mostly by larger global brands—the free version of GA, however, is more than sufficient for most marketers.
GA Account Structure
To set up the account properly, it's important to first understand that GA is structured into three sections: Account, Property and View, as shown in Figure 9.4.
1. Account refers to the actual GA account; for example, the business or brand.
2. Property refers to each individual website, and businesses can add more than one.
3. View refers to the filter that is applied to the data. For example, a filter that excludes internal traffic can be applied.
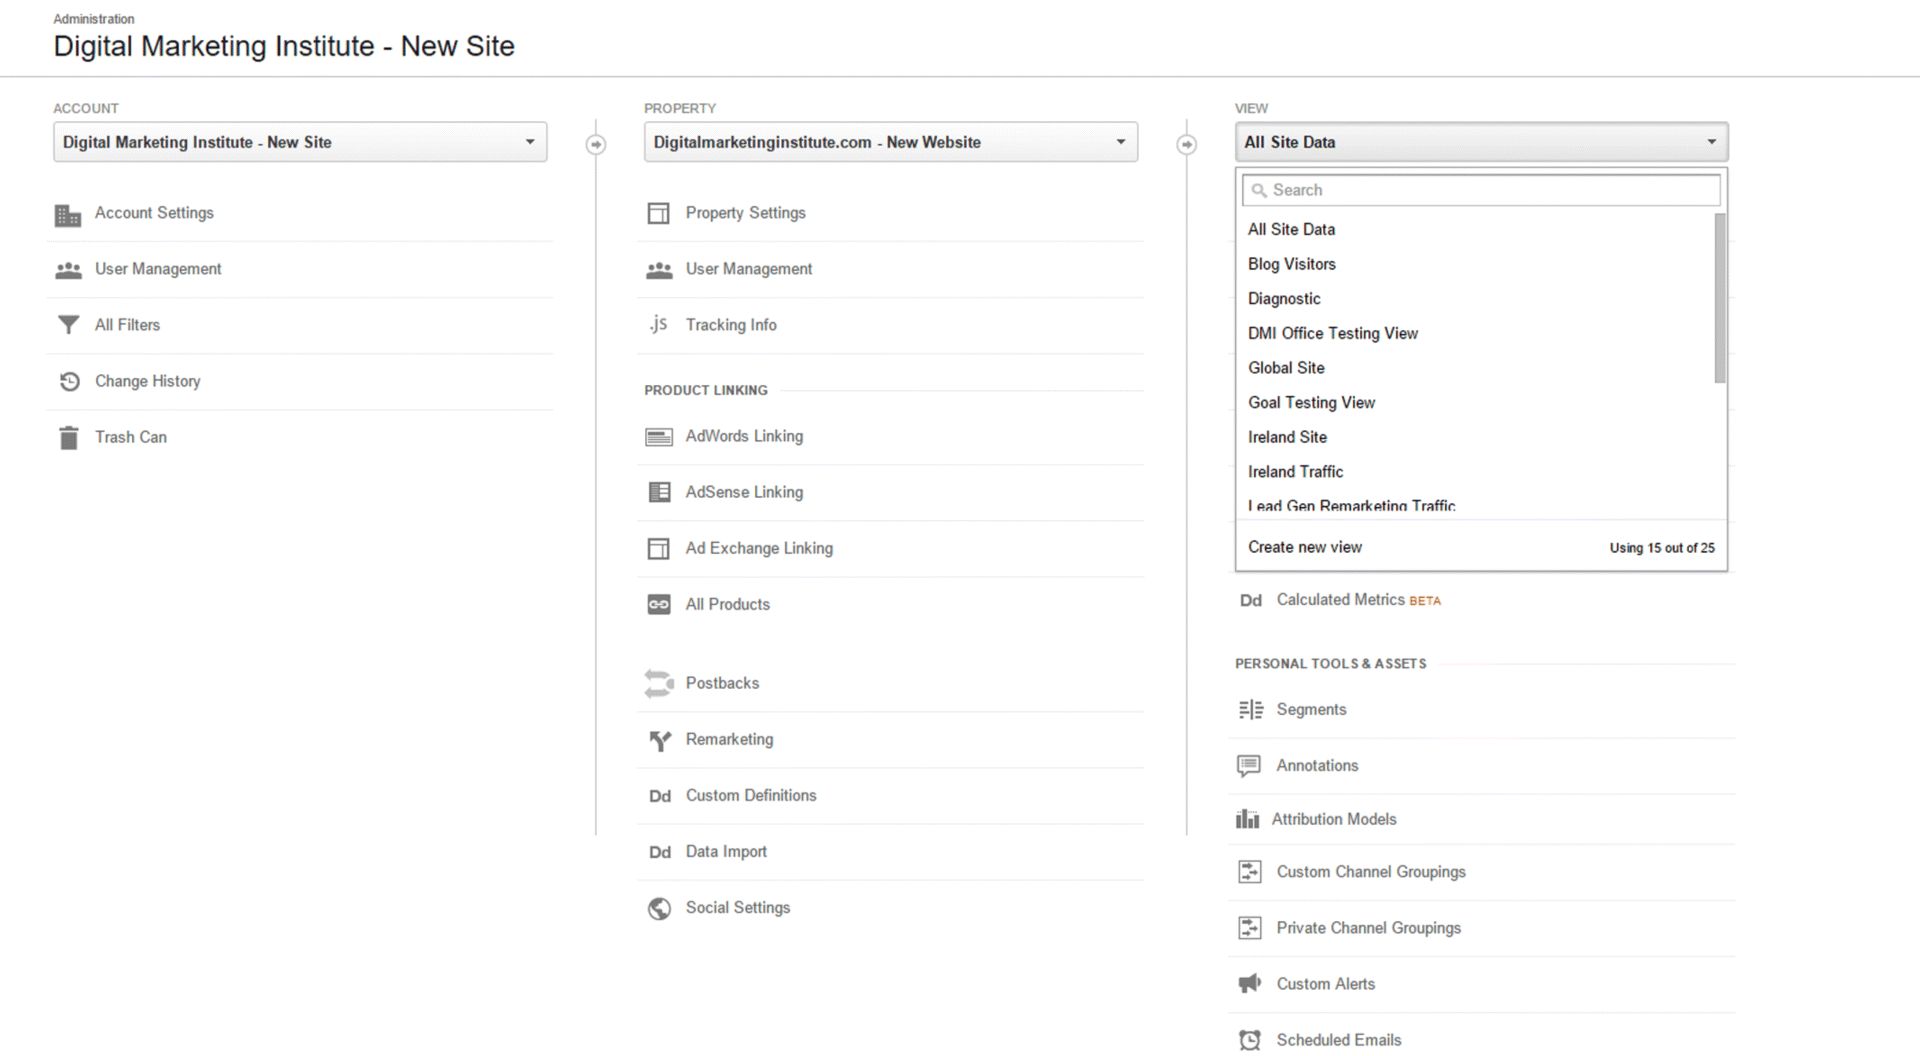
Figure 9.4 GA Three-Section Structure
Source: Google and the Google logo are registered trademarks of Google Inc.; used with permission.
GA Access Levels
GA provides four levels of user access, which, for administrative and security reasons, is very useful. For example, in large companies, it may be problematic to have several hundred people accessing and editing the same data! The levels of access are:
1. Managed User. Administrative level; can do absolutely everything.
2. Edit. Administrative level functions without the ability to add or delete users. This is the minimum level of access required to link GA with Google AdWords.
3. Collaborate. Can edit shared assets and read and analyze all reports.
4. Read and Analyze. Can make no changes, just observations.
GA Account Setup
Now the structure and the tiers of access are understood, let's set up an account.
1. Type in www.google.com/analytics.
2. Click on the sign-up button to enter your details. You will need a Google account, such as Gmail or AdWords, to register.
3. Name your account in the field shown in Figure 9.5. This is you, or the brand/business you represent.
4. Add properties. Add the URLs of the sites you wish to track.
5. Set any views required; for example, one that excludes internal traffic. These filters are covered in detail later, but essentially the View function enables reports to be organized into different sets. These sets can be named for convenience and tailored for certain users.
6. Set your time zone correctly, as shown in Figure 9.6. Once set it can't be changed, and your data will be skewed if it is wrong!
7. Get your tracking code. This facilitates the tracking of the site and is shown in Figure 9.7. In some instances it may need customizing. For example, if your site accepts transactions you will need to set up a special e-commerce code.
8. Add your tracking code to your website. This should be inserted immediately before the closing header tag, at the top of the page. Remember, the lower down the code is inserted, the longer it takes to load—which could mean hits are not recorded correctly.
9. Adjust account settings. Customize the GA interface to meet your needs, using the Admin tab (see below).
Figure 9.5 GA Setup
Source: Google and the Google logo are registered trademarks of Google Inc.; used with permission.
Figure 9.6 Setting GA Time Zone
Source: Google and the Google logo are registered trademarks of Google Inc.; used with permission.
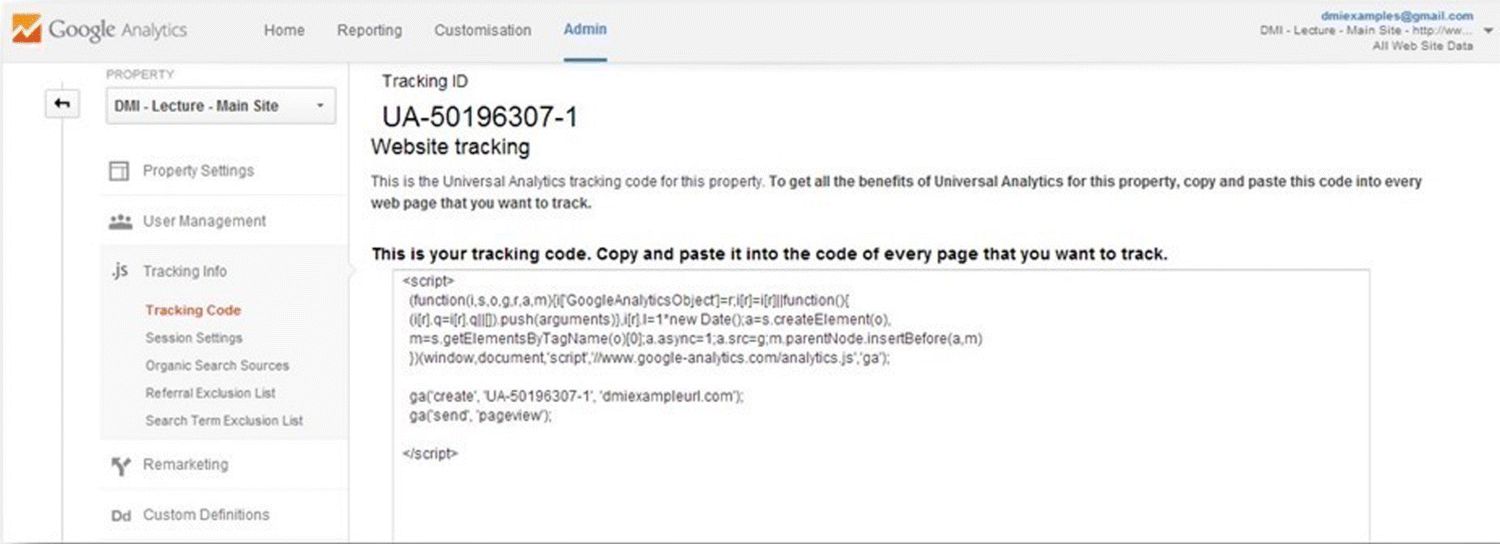
Figure 9.7 GA Tracking Code
Source: Google and the Google logo are registered trademarks of Google Inc.; used with permission.
GA Navigation
Having set up your account, let's now look at how to navigate around it. First, you will be presented with a page showing these tabs: Home, Reporting, Customization, and Admin.
1. Home. This is the view you will be presented with upon log-in. It displays the account, with the properties and views listed beneath. If you have got multiple accounts, properties, or views, it is possible to flag specific ones to create a more customized view.
2. Admin. This tab configures different settings for each individual property, such as setting the default page, excluding URL query parameters, making e-commerce site selections, setting session time-out length, and setting up site search. You can also import media spends and add PPC data.
3. Customization. This tab is where you will find any custom reports once they have been configured.
4. Reporting. This is essentially the main menu, containing dashboards, shortcuts, intelligence events, and all the standard reports. The default report shown is Audience, which provides a website overview.
5. Under Reporting you can also set Intelligence Events. These are alerts that can be designed to go out in real time, to specific GA users, in order to flag events that are relevant to the business. For example, you may want to set an IT alert should the site stop loading.
Gaining a return from analytics requires ongoing monitoring, analysis, and enhancement, but understanding the setup, functionality, and structuring of GA is the first step in this process. Stage 3 will now apply this knowledge and explore GA at a much deeper level.
Stage 3: Monitor
Now that you understand how to set up GA, it's time to look at the different types of reports available and how these can help improve your website.
This section addresses stage 3 of the analytics process—monitoring audience data, as shown in Figure 9.8—and explains how GA can show who site users are and how they behave.
Figure 9.8 Focus on the Third Stage in the Analytics Process
By the end of this section you will:
· Understand how analytics helps us learn about audiences.
· Recognize the user journey that analytics tools can track.
· Appreciate the wider marketing and business implications of online audience analytics.
Audience Overview
When logging into the Reporting tab, the default view will be Audience, as shown in Figure 9.9. Let's explore some of the information available here, the reasons for analyzing it, and the type of insights it can produce.
Figure 9.9 Audience Overview Section of GA Reporting
Source: Google and the Google logo are registered trademarks of Google Inc.; used with permission.
Demographics
Demographics analytics is about understanding who users are so they can be better targeted. Age and gender are prominent filters on the GA dashboard and the data reveals how each demographic behaves. Insights can be drawn that have huge implications; for example, noticing that females convert more often than males, as in Figure 9.10, might mean an adjustment in targeting is needed.
Figure 9.10 Demographics Section of GA Reporting
Source: Google and the Google logo are registered trademarks of Google Inc.; used with permission.
Geo
Location data shows which countries the site is accessed from and by how many people, as shown in Figure 9.11. It helps ensure an appropriate marketing strategy and can highlight new opportunities; for example, growing traffic from a currently untargeted country.
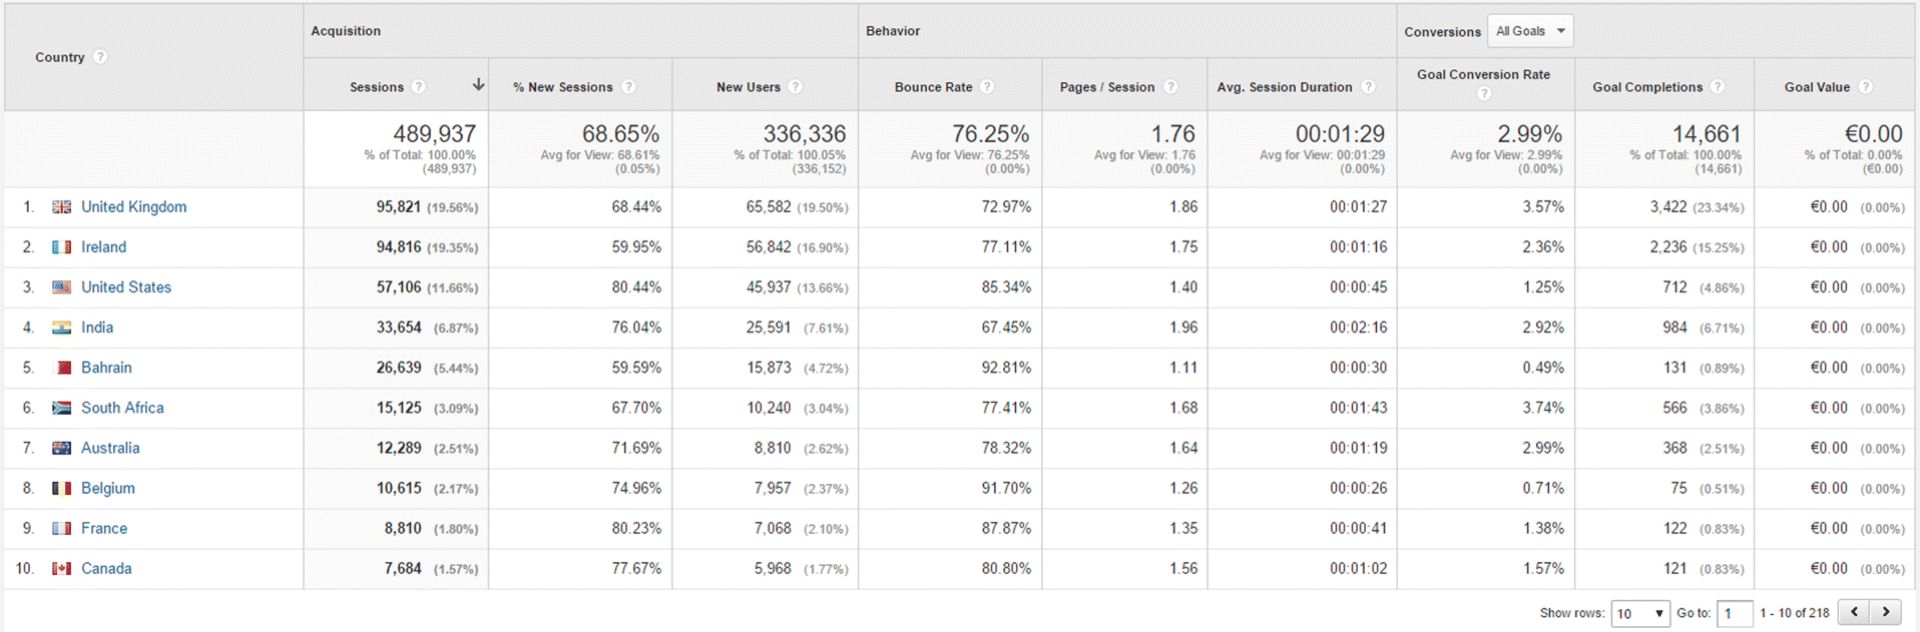
Figure 9.11 Geo Section of GA Reporting
Source: Google and the Google logo are registered trademarks of Google Inc.; used with permission.
Language data can be very revealing; for example, learning that most of the audience are nonnative speakers of the website language would necessitate some strategy adaption!
Behavior
Having identified ways to see who users are, the next step is to look at how they behave and what this means. This requires tracking users with cookies, as covered in the previous section.
User Journey
Mapping the user journey is about understanding which users return (as shown in Figure 9.12), what they do on the site, and how engaged they are.
Figure 9.12 User Journey Information in GA
Source: Google and the Google logo are registered trademarks of Google Inc.; used with permission.
Understanding who converts when, and why, means the website can become more optimized, the sales funnel more lucrative, the copy more relevant, and the budget spent more efficiently.
Ultimately, it is about defining what new users want versus those who are returning and using that knowledge to guide each subtly to a sale.
For example, your report might show that returning users are registering for more information before eventually converting. In this case, it might be ideal to launch an email campaign targeting only returning users and speed up the process by selling higher up in the sales funnel. They are already quite likely to purchase, so this would be an efficient way to capitalize on targeted leads.
Technology
Behavior also highlights technical issues. This is useful for two reasons—it improves user experience and ensures the site operates properly—both of which improve conversions!
Audiences will quickly lose interest if the site does not provide them with a beneficial user experience, so it vital that user behavior is monitored across a range of devices, to ensure that engagement is fairly consistent. See, for example, the engagement across different screen resolutions in Figure 9.13. Ultimately ensuring consistency among these resolutions will impact conversion rates.
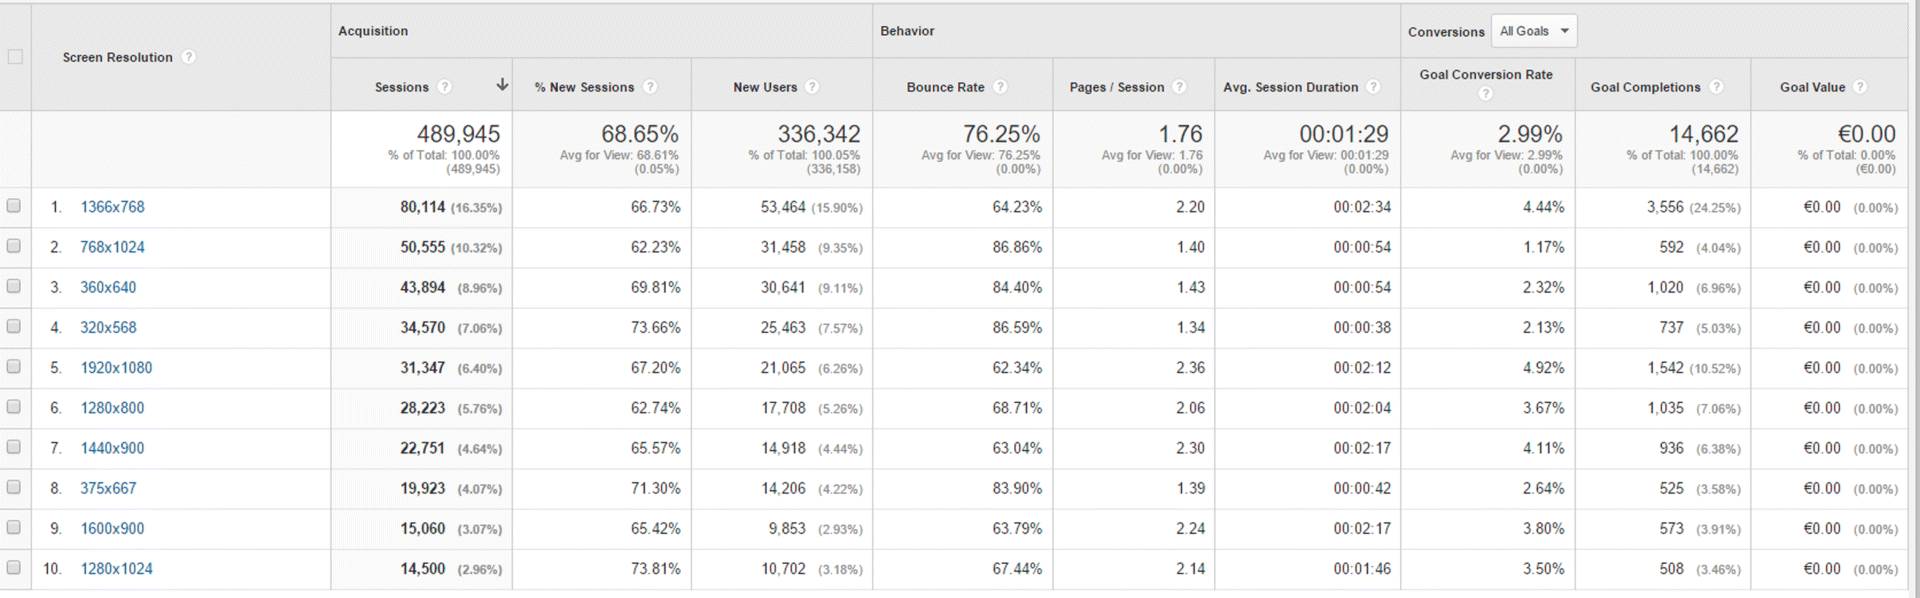
Figure 9.13 Technology Information in GA
Source: Google and the Google logo are registered trademarks of Google Inc.; used with permission.
It is important that the site operates properly on different browsers; analytics can track user behavior on different browsers to monitor this. For example, a high bounce rate or low engagement among Safari, but not Chrome, users may mean the website is not displaying correctly.
Mobile
There is no disputing the enormous, growing importance of mobile. Users want specific answers immediately, and they won't waste time on sites that do not provide them! It is therefore important that the mobile site is optimized, and that users can easily navigate to what they need.
Data (such as the volume and engagement of mobile traffic) can be analyzed to ensure this is the case. Bear in mind that the fast nature of on-the-go mobile browsing makes bounce rates naturally higher, and on-site times naturally lower, as seen in Figure 9.14. This is to be expected, but if users leave instantly or CTA conversions are pitiful, then perhaps the site needs improvement! The CTA could be stronger, for example, with a click-to-call button or reorganization of information.
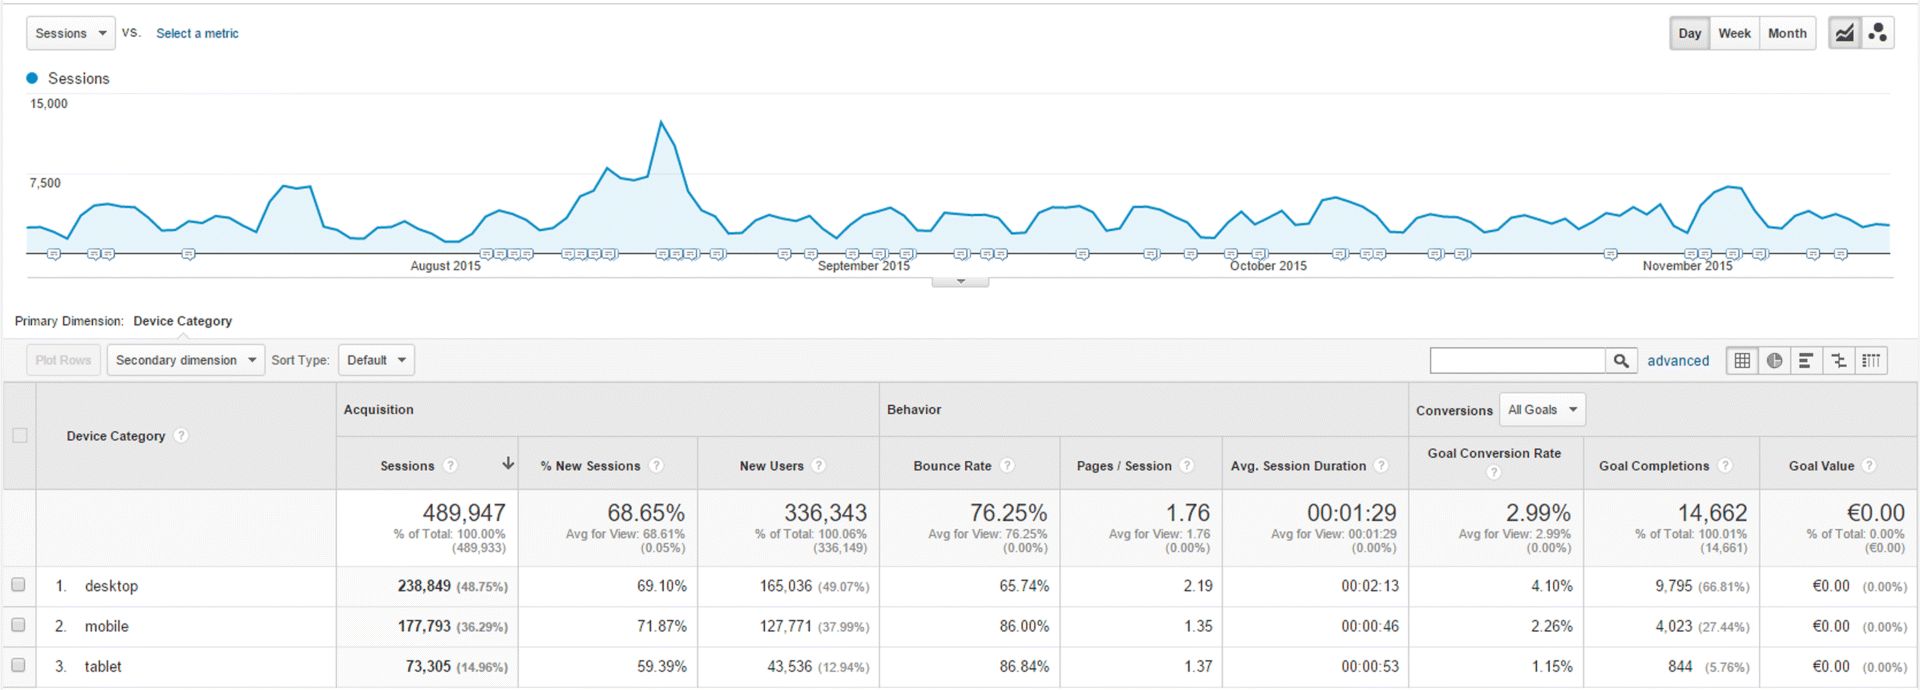
Figure 9.14 Sessions by Device Category in GA
Source: Google and the Google logo are registered trademarks of Google Inc.; used with permission.
Offline Implications
Online user data can powerfully inform offline marketing too. Website stats detail who audience members are and how likely they are to convert so precisely that it could lead to a real shift in wider strategy. Sometimes it can even uncover audiences the business was previously unaware of!
By understanding who users are and how they behave, a picture begins to emerge of the website changes that are required—both technical and with respect to content. The aim is to use this knowledge to make the site as targeted as possible, and as the next few sections explain, to understand and apply analytics in a way that is relevant to the business context!
Acquisition
Having looked at how to determine who users are and how they behave, this section now focuses on where they come from.
This section is about measuring, reporting on, and comparing the value of different website and campaign traffic sources. It provides an overview of the various channel reports GA can produce and how to go about setting these up. By the end of this section, you will understand:
· Why acquisition reporting is important and what it entails.
· The different channels that GA can report on.
· How to integrate Google AdWords and the benefits and rationale for doing so.
· How to use the Google URL Builder and set up custom tracking of online campaigns.
Acquisition Reporting
Acquisition reporting involves the measurement and evaluation of traffic sources, and there are numerous ways this can be done in GA. The abundance of data and reporting options can seem overwhelming, so remember to focus on developing and using only relevant reports. Customizing GA, Custom Channels, interpreting data, and medium and source are covered next.
Customizing GA
1. GA is highly customizable, and Custom Channels (used to track personalized channels as required) can be added easily under the Admin tab. Similarly, there is a comprehensive Advanced Search tool located in the top right-hand corner. This can be used to filter traffic types, among other variables, with a simple drop-down menu.
Custom Channels Overview
1. To begin, simply click into Acquisition and then Overview within GA to produce a top-level breakdown of the different traffic-driving channels, displayed in the basic charts seen in Figure 9.15. The aim is to understand which channels bring not just the highest volume of traffic, but crucially, the most valuable, engaged, and high-converting traffic.
Interpreting Data
1. Channel data such as bounce rate, total sessions, and conversions can be examined, and areas for development highlighted. An important analysis is the number of goals that each channel delivers; for example, if organic search achieves a high volume of goals, maybe paid search should expand.
2. Just remember to avoid assumptions—instead draw conclusions that make sense to the business in question and prioritize relevant channels!
Medium and Source
1. Reports can be organized and viewed by medium (the channel) and source (the specific platform), as shown in Figure 9.16. For example, you might search for the medium organic search and the source Google. Similarly, the medium might be display and the source the New York Times.
Figure 9.16 GA Report by Source/Medium
Source: Google and the Google logo are registered trademarks of Google Inc.; used with permission.
Figure 9.15 GA Custom Channels Overview
Source: Google and the Google logo are registered trademarks of Google Inc.; used with permission.
Important Traffic Channels
The following are key traffic sources that often yield very interesting data! Should you encounter a not provided notification, fear not! Data from users logged in to any Google account (such as YouTube, Gmail, etc.) is not passed on, and this is Google's notification that some data can't be provided.
Organic Search
1. Organic search can drive very high volumes of valuable traffic, as the user will already be aware of the brand and ready to engage with it. Traffic will be mostly from Google, but will also include sources such as Bing and Yahoo, despite their small share. In some contexts (such as markets where sources other than Google have a bigger share) this can be very useful data that can lead to changes in strategy; for example, if Bing traffic had a lower bounce rate associated with it.
Google Webmaster Tools
1. By linking Webmaster Tools with GA, a lot more data becomes available. As can be seen in Figure 9.17, the options listed under Search Engine Optimization will lead to the simple Webmaster Tools set-up process. Once the accounts are linked, it is possible to see all the organic search keywords driving traffic, the volume of traffic they drive, and how these keywords rank.
2. Knowing which keywords do, and do not, deliver traffic and conversions is very helpful. Keywords that perform well could inform an SEO strategy, increase organic traffic, and be used in AdWords. It is also useful to see which landing pages perform best and which could be optimized to increase rankings, achieve higher click-throughs, and ultimately get more traffic.
Figure 9.17 The Search Engine Optimization Section within Acquisition Leads to the Process of Linking Webmaster Tools with GA
Source: Google and the Google logo are registered trademarks of Google Inc.; used with permission.
Referral Traffic
This means traffic that comes from another website; for example, when a user follows a link. Click on Referrals to view the sites that are referring the traffic and to compare data between different referrers.
Using the averages displayed in the top bar in Figure 9.18, it is possible to gauge the quality of that traffic; for example, to evaluate how engaged users are, how long they stay, and whether they convert. The insights gained here could direct a wider SEO strategy. If, for example, your site was drawing in a lot of traffic from a particular channel, you could capitalize on that by adding a permanent backlink.
Figure 9.18 Referral Traffic Information within GA
Source: Google and the Google logo are registered trademarks of Google Inc.; used with permission.
Social
It can be tempting to think of social channels as their own entities, separate from the website. It might be said, for instance, that Facebook engages users on a page, aids brand awareness, and drives some traffic to the site—which is great. However, it would be much wiser to treat it as an extension of the sales funnel, and use it as a starting point in the conversion process! GA therefore monitors much more than social-media traffic volumes; it also reports on the quality of that traffic (as shown in Figure 9.19) and to what extent specifically goals and conversions are achieved.
Figure 9.19 Social Referral Information within GA
Source: Google and the Google logo are registered trademarks of Google Inc.; used with permission.
Campaigns
Along with tracking channels, it is also important to report on the traffic performance of individual campaigns. Again, metrics such as bounce rate, sessions, pages per session, and average session duration are all incredibly useful in evaluating and justifying campaigns.
AdWords
The real magic of AdWords and GA is in linking them to combine their data, as shown in Figure 9.20.
Why Link AdWords and GA?
1. Once you you're your AdWords and GA accounts, a specific, richly detailed AdWords report is produced in GA, detailing clicks, costs, pages per session, conversion rate, and goal completions. Seeing how traffic engages helps to justify the CPC, and the most valuable campaigns can then be identified and prioritized.
2. Don't worry if the data displayed in GA and AdWords does not match exactly; a 20 percent discrepancy is actually normal. This is because each records things like backclicks and double clicks differently, and occasionally the GA code can be slow to load.
How to Link AdWords and Analytics
1. In order to link these two platforms, the same email address is required, and a minimum of Edit or Admin access is necessary in each interface. From the GA Admin tab navigate to Property, select the AdWords linking section, name the link group, and then tick the desired link view.
Day Parting
1. This reveals which times deliver the best value for click-throughs, engagement, and reaching particular AdWords goals. Traffic value depends entirely on the KPIs and goals in place; maybe the aim is site engagement, or perhaps it's hard conversion. Either way, progress can be reported hourly, as shown in Figure 9.21, showing when to invest or reduce effort, and when to increase or decrease bids.
Figure 9.20 Process of Linking Google AdWords and GA
Source: Google and the Google logo are registered trademarks of Google Inc.; used with permission.
Figure 9.21 Day Parting Report within GA
Source: Google and the Google logo are registered trademarks of Google Inc.; used with permission.
Google URL Builder
The Google URL Builder tags each element within a campaign, so that analytics data can be organized very specifically and later pulled into relevant reports, as Figure 9.22 shows. The builder creates a URL for each campaign component, categorizing everything to track campaigns very precisely.
Figure 9.22 Google URL Builder
Source: Google and the Google logo are registered trademarks of Google Inc.; used with permission.
AdWords data is automatically tagged and does not need the URL Builder. It is necessary for all other campaigns, however, or traffic will simply be classified as referral traffic, and insights will lack significance. The key with the URL Builder is to use a consistent naming convention, so that elements are tagged appropriately and pulled into reports when required.
As an example, when filling out URL Builder fields for the campaign, you could add the following:
· Website URL (e.g., www.external-website-campaign.com).
· Source (e.g., the New York Times).
· Medium (e.g., display).
· Term (e.g., optional keyword).
· Content (use a word that will differentiate among similar campaign ads).
· Campaign Name (e.g., September 2025).
Upon hitting Submit, a long URL is produced that tells GA the source, medium, name, term, and content tags—and just like that, campaign data will now be collected and organized correctly!
Depending on the business needs of each campaign, there are both basic and complex ways to track and analyze traffic. Crucially, there are also numerous ways to interpret the data, and you should ensure the reporting organization is spot-on before making wild assumptions!
Behavior
Having established various ways to monitor traffic and segment audiences, let's now examine on-site behavior. Applying what we've learned from the previous two sections, it's time to start to mapping the user journey at a more intricate level.
This section is very important and so it has been divided into two parts—the first is focused on using analytics to optimize website content by understanding the user journey; the second explores two particularly useful behavioral tools in more detail.
Using Analytics to Understand the User Journey
We will first explore how users behave on and interact with different pages, and how this behavior and interaction can be interpreted. By the end of this section, you will understand:
· The various types of behavioral reporting and the characteristics of each.
· The depth of insight that behavioral reports can provide.
· The importance of using a variety of analytical metrics, reports, tools, and approaches to really tell the full story.
Behavior Reporting
1. User journey. When viewing the data it is possible to see users' movement throughout the site almost three or four levels deep. This is viewed through the Behavior Flow tab shown in Figure 9.23. It shows us how users engage with the site; specifically, what page they initially entered, where they visited next, when they dropped off, and where they went afterwards.
2. In-page analytics. This is essentially a heat map of the site that shows how users engage with specific pages; virtually anything can be analyzed, as shown in Figure 9.24. We recommend that you sort the top-performing pages by various metrics; you can do this simply by clicking on each of the individual headings.
3. Site speed. This is an important issue for SEO and also user experience—both factors that influence the goal conversion rate and SERP ranking. Users' perceptions on websites are formed very quickly, and getting a negative reaction can cost a business a lot! Just a one-second delay in page load times can result in a 7 percent reduction in conversions. For a business earning $100,000 per day, this equates to over $2.5 million in lost revenue in a year—not cool.
Site speed can be analyzed by browser, country, or even by page, as shown in Figure 9.25. By combining this with other data, such as technology reports, it is possible to really assess site performance and isolate issues.
4. PageSpeed Insights tool. GA can even score individual pages from 0 to 100 and provide suggestions for improvement in a handy pop-up—as shown in Figure 9.26. You can take action on these suggestions and then monitor how successful the fixes are.
5. AdSense. If the site runs ads from this program, their performance can be viewed here.
6. Experiments. This option allows for A/B testing of different elements of the site, such as moving buttons around, trying different optimization ideas, and assessing conversions based on different settings.
Analyzing Behavior
1. Benchmarks. A reoccurring lesson in this chapter is that analysis must be done within the context of the business and its goals. For instance, not every website requires long sessions—some may have a short sales funnel and a speedy conversion aim. In this context, a longer engagement period could actually be an indication that something is wrong; for example, that users cannot navigate the site easily.
2. Combining reports. To avoid making assumptions, it is important to assess data across all relevant reports. Using several reports to analyze your data will give you a richer story and convey a more realistic idea of what is going on.
3. Combining metrics. Similarly, it's important to look at multiple metrics in relation to each other to paint the full picture.
4. The user journey. The key, once user journeys have been mapped and reports compared, is to work backwards to understand why consumers are leaving the site or not converting. If there is a high exit rate in certain places, then the next step is to use appropriate reports to try to determine why.
Figure 9.23 Behavior Flow Tab in GA Behavior
Source: Google and the Google logo are registered trademarks of Google Inc.; used with permission.
Figure 9.24 In-Page Analytics in GA
Source: Google and the Google logo are registered trademarks of Google Inc.; used with permission.
Figure 9.25 Site Speed by Page in GA
Source: Google and the Google logo are registered trademarks of Google Inc.; used with permission.
Figure 9.26 Google Page Speed Insights Tool
Source: Google and the Google logo are registered trademarks of Google Inc.; used with permission.
Using Site Search and Event Reporting
Having established why it is important to understand the user journey and the various metrics for monitoring and analyzing it, we're now going to examine two very useful behavioral reports: Site Search and Event Reporting. These are detailed tools to further understand user behavior and they will now be explored fully. By the end of this section, you will understand:
· How to pull the Site Search report and the rich benefits from doing so.
· What event tagging is, how to set it up, and why it is useful.
Site Search
1. Using this tool, shown in Figure 9.27, it is possible to see what users have been looking for—and more importantly, what they were unable to find. This is very actionable data, as it tells us specifically where the website is falling short—both in terms of user experience and content.
2. For example, the rule of thumb is that users should find content within three clicks, so the site might need reorganizing to accomplish this. Or perhaps new content could be added to fulfill a previously unknown need. These improvements should positively impact goal conversion rates, especially since users searching the site are typically more engaged.
3. To access site search data, simply import user queries from under the Admin tab.
Event Reporting
1. If you need to track engagement at a more in-depth level, such as brochure downloads or video playback, then Event Reporting, shown in Figure 9.28, is the answer! This is the ideal way to track users through very precise steps, especially those that leave the site. Event Reporting is also very goal orientated, as it allows you to assign a custom value to each event.
2. For example, while standard reporting may show how many people visited a page containing a video, Event Reporting indicates how many people are pressing play, pause, or even turning down the volume of the video. It is possible to learn at what point they click away, and track the percentage of direct conversions the video produces. This data is great for assessing things qualitatively, to get an idea of what people think or feel about the video, and how it might be improved. An explanation of how to use Event Reporting follows.
· Combining reports. The real beauty of Event Reporting data comes from merging and analyzing it with standard reporting, so that you get a lot more insight into the story. For example, standard reporting might show that one particular page has a high bounce rate; but by tracking every single element on that page (as in Figure 9.29) the exact moment a user exited (and why) can be pinpointed and analyzed.
· Setup. This is done using an event-tracking generator called the GA Configuration Tool (go to www.GAconfig.com). Fill out the required fields, ensuring that the naming convention you use is consistent. It will produce a piece of code to be attached to whatever requires monitoring; for example, a Download button. Depending on your technical abilities, a developer's assistance may be needed to attach the code—now is the time to cozy up to your IT department!
· Actions, labels, and categories. There are three components to naming events in Event Reporting: actions, labels, and categories. To use a video example as an example, the tracking could be named as follows:
1. Action: Video playback
2. Label: Product video
3. Category: Face cream
This event can be tracked in many ways. For example, the event could be tracked with the action named social share instead, with the aim of seeing how many people are sharing the video instead of watching it. By comparing all this data, interesting in-depth analysis can be carried out to see how users are behaving in relation to very specific elements.
Figure 9.29 Combining Event Reporting and Standard Reporting in GA
Source: Google and the Google logo are registered trademarks of Google Inc.; used with permission.
Figure 9.28 Event Reporting in GA
Source: Google and the Google logo are registered trademarks of Google Inc.; used with permission.
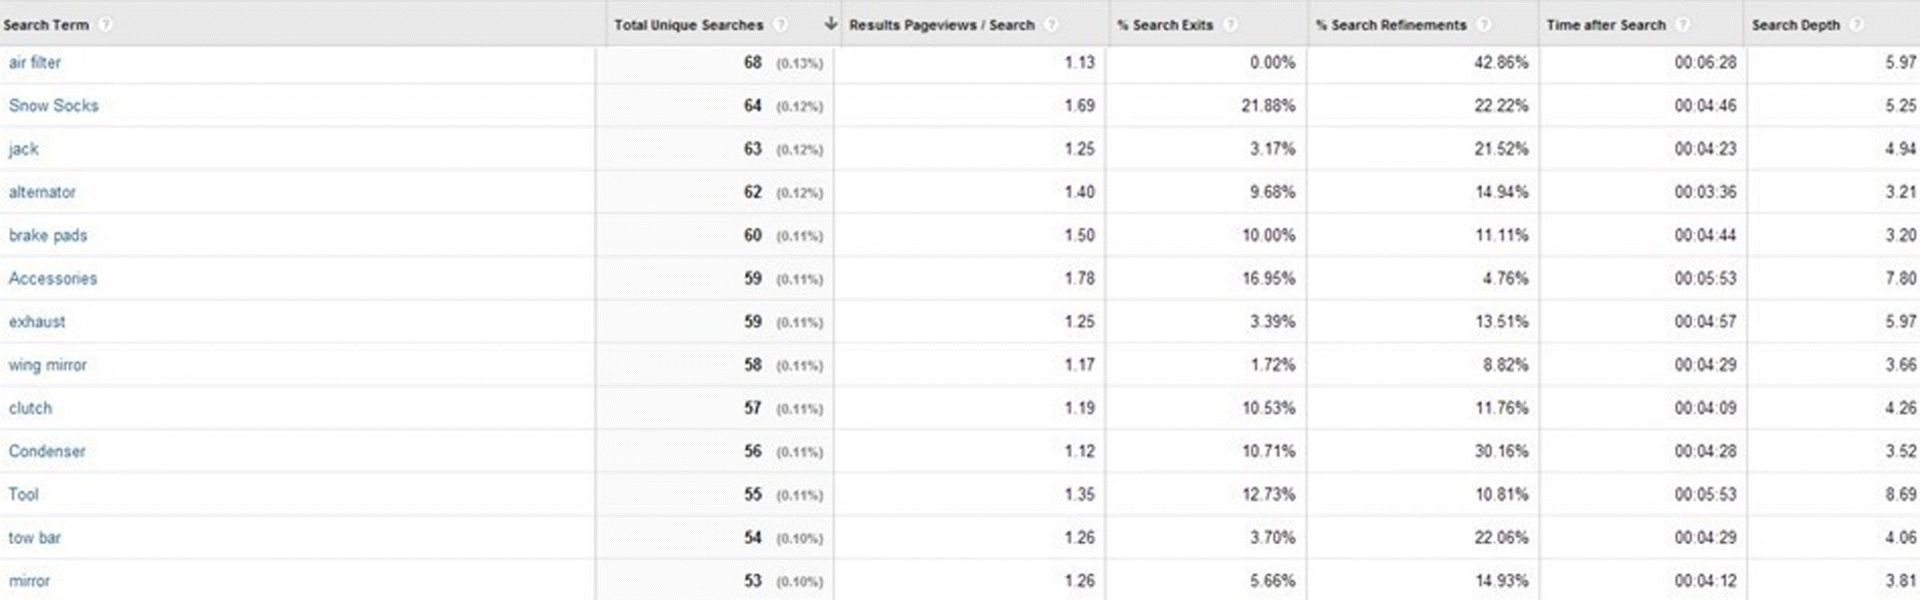
Figure 9.27 Site Search Report in GA
Source: Google and the Google logo are registered trademarks of Google Inc.; used with permission.
There are lots of ways to monitor and understand users, but the important thing is to use a mixture of them all, so that conclusions are informed and balanced. It is not enough to rely on one report, one tool, or one basic assumption! Instead, aim for a well-rounded approach, using several reports, data sets, and methods to tell a complete story and produce deeper insights.
Stage 4: Analyze
Having touched on conversions in the previous sections, this section now looks in some detail at what it means to use analytics in the context of specific goals. This section deals with the highlighted stage in Figure 9.30—stage 4 of the analytics process—at which marketing efforts are evaluated with regard to how they deliver on conversion KPIs.
Figure 9.30 Focus on the Fourth Stage in the Analytics Process
By the end of this section, you will understand:
· Why conversion goals are important.
· The different types of conversion reporting possible in GA.
· What the sales funnel is and how it relates to meeting certain goals.
· How to set different goals and the various characteristics of goals.
What Is a Conversion?
It's the completion of a site activity that represents success to your business—a sale, for example. Measures of success will vary wildly among different businesses and markets, so once again bear in mind that context is absolutely everything in analytics and setting goals.
To decide what your conversion goals should be, simply consider what your website is trying to achieve in order to meet your business objectives. It might be a transaction, it might be clicking on a link, or it might be registering for an email newsletter.
The Sales Funnel
This refers to the group of clearly defined steps that lead to particular conversions; analyzing them can help in measuring the conversion process. The reports show where users have entered into each step in the funnel, where they leave, and the percentage of users that go all the way through it. Creating a sales funnel is straightforward and can be added to any goal at any time—but it is best suited to events and URL destination goals. Figure 9.31 shows a sales funnel that was created for a URL destination goal.
Figure 9.31 Sales Funnel Report in GA for URL Destination Goal
Source: Google and the Google logo are registered trademarks of Google Inc.; used with permission.
Conversion Reporting
There are four sections to the Conversions report in GA: e-commerce, goals, multichannel funnels, and attribution. The first two are discussed next; the latter two will be discussed later in this chapter.
E-commerce
This section is for sales-focused sites with specific transactions.
The reports here go into quite some detail, allowing us to look at products sold, the volumes involved, and revenues generated—for example, Figure 9.32 shows product performance comparisons. The detail can also extend to the value of products in baskets per product across all users compared to the value of products actually purchased.
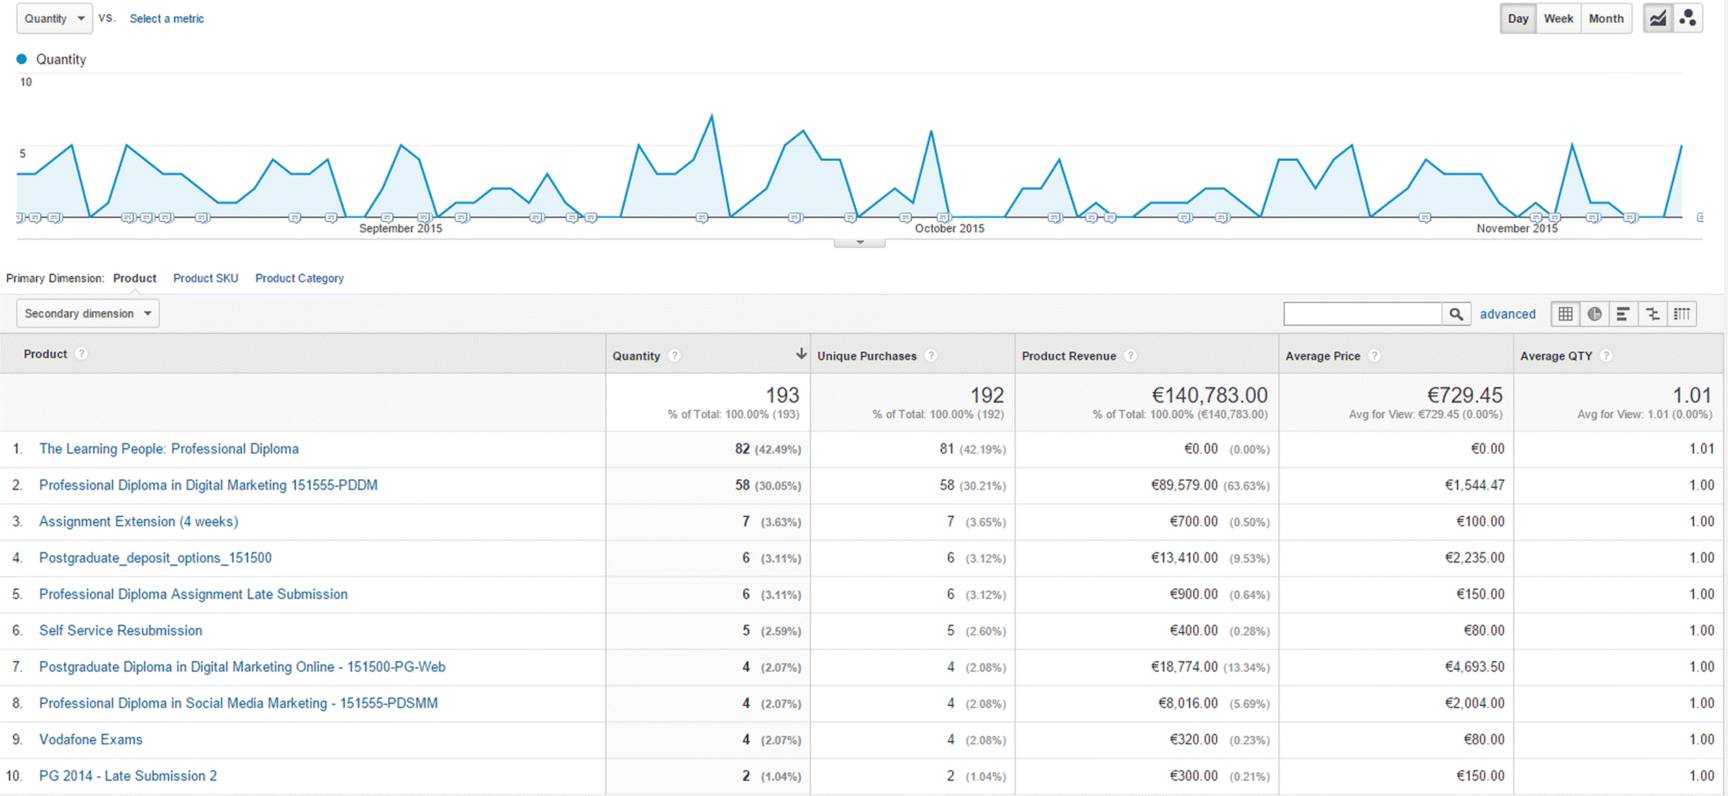
Figure 9.32 Product Performance Comparison Report in GA eCommerce Section
Source: Google and the Google logo are registered trademarks of Google Inc.; used with permission.
This type of data is perfect for justifying investment and demonstrating the value of upsell marketing! It's also useful when deciding how long a campaign should run for, because the data shows how long users take to make purchase decisions and how long they need to complete transactions.
Goals Overview
Figure 9.33 shows a multistep conversion process within the Goals section of GA. This subtab is extremely important for highlighting any weak points in the conversion journey. There are four main types of goals:
1. URL destination goal. This is a specific page shown in response to a positive user event; for example, a thank-you page being displayed after someone signs up for an email newsletter. In Figure 9.34 the name of such a page is set as Contact Us Form Page and the request URL has been entered. You can assign a value to the goal and easily check that it is set up correctly.
2. Time on site. Shown in Figure 9.35, this is very useful for content-driven goals; for example, if you wish to encourage lengthier engagement with your blog. The goal set here could be related to engagement (you desire that more time be spent on a site generally) or microconversions (how long it takes for a user to convert specifically).
3. Pages per session. Shown in Figure 9.36, this is similar to time on site; however, you must select a whole number for your goal, regardless what the current average is. Always aim above it, so there is a target to reach for.
4. Event Tracking report. Remember we covered this earlier in the section about behavior? Simply follow the on-screen prompts shown in Figure 9.37 to set it up and get a great insight into your customer's actions.
Figure 9.33 Multi-Step Conversion Process in Goals Section of GA
Source: Google and the Google logo are registered trademarks of Google Inc.; used with permission.
Figure 9.34 URL Destination Goal in GA
Source: Google and the Google logo are registered trademarks of Google Inc.; used with permission.
Figure 9.35 Time on Site Goal in GA
Source: Google and the Google logo are registered trademarks of Google Inc.; used with permission.
Figure 9.36 Pages Per Session Goal in GA
Source: Google and the Google logo are registered trademarks of Google Inc.; used with permission.
Figure 9.37 Event Goal in GA
Source: Google and the Google logo are registered trademarks of Google Inc.; used with permission.
Setting Goals
Goals are visible at the View level, and up to 20 can be set for every new view that is added (although they can also be added under the Admin tab). You can opt to set either a custom or standard goal, and both can be set up very simply by following the prompts (shown in Figure 9.38).
Figure 9.38 Goal Setup in GA
Source: Google and the Google logo are registered trademarks of Google Inc.; used with permission.
Remember, goal data cannot be tracked retrospectively; it can only be tracked forward from the date it is set.
Goals are a brilliant way to optimize analytics for the measurement of specific KPIs, helping the site meet relevant business aims. This function of reporting is really versatile, and its application across several reports will now be examined.
Attribution
Having established the importance of goals, let's now look at assigning values to the channels that help achieve them. This section will ensure you:
· Understand the nonlinear nature of conversions.
· Understand the benefits of assigning a value to each channel.
· Recognize the different models for assigning value, and when these might be required.
Attribution reporting. The first report under the Conversions tab is multichannel funnels, which looks at the paths users take when they're journeying to conversion. Look at Figure 9.39 for examples of these paths.
Figure 9.39 Channel Grouping Paths in GA
Source: Google and the Google logo are registered trademarks of Google Inc.; used with permission.
Why assign values? The way users make purchasing decisions is not always straightforward, and they may arrive at conversions by many different means! As such, it's important to understand the role each channel plays, as seen in Figure 9.40, so that a given channel can be optimized properly and any expenditure justified.
Figure 9.40 Attribution Reporting in GA
Source: Google and the Google logo are registered trademarks of Google Inc.; used with permission.
Assigning values allows credit to be given to channels that helped secure a conversion, so that the influential steps in the sales funnel can be discovered. Websites can then be adapted to influence users where it resonates!
Attribution models. These models assign a value to each channel that played a role in the purchasing path, and they provide varying frameworks for assessing and evaluating each channel.
The model that is used to evaluate the channel's role will vary depending on the business context. For example, an e-commerce site might wish to value the search activity very highly, regardless of how much traffic it drives, simply because searching is hugely influential in purchasing decisions. Models include:
· Last click. Favors the last channel, because it is the one that referred the converting user.
· First click. Champions the very first channel—the introducer—for inspiring the purchase.
· Linear. Assigns equal value to every channel that played a role.
· Time decay. Seen in Figure 9.41, this model assigns an increasing value to each channel as the user gets closer to conversion; for example, the first channel might be awarded 10 percent; the second, 20 percent; the third, 30 percent, and so on.
· Position-based. Assigns a value to the first and last interaction only.
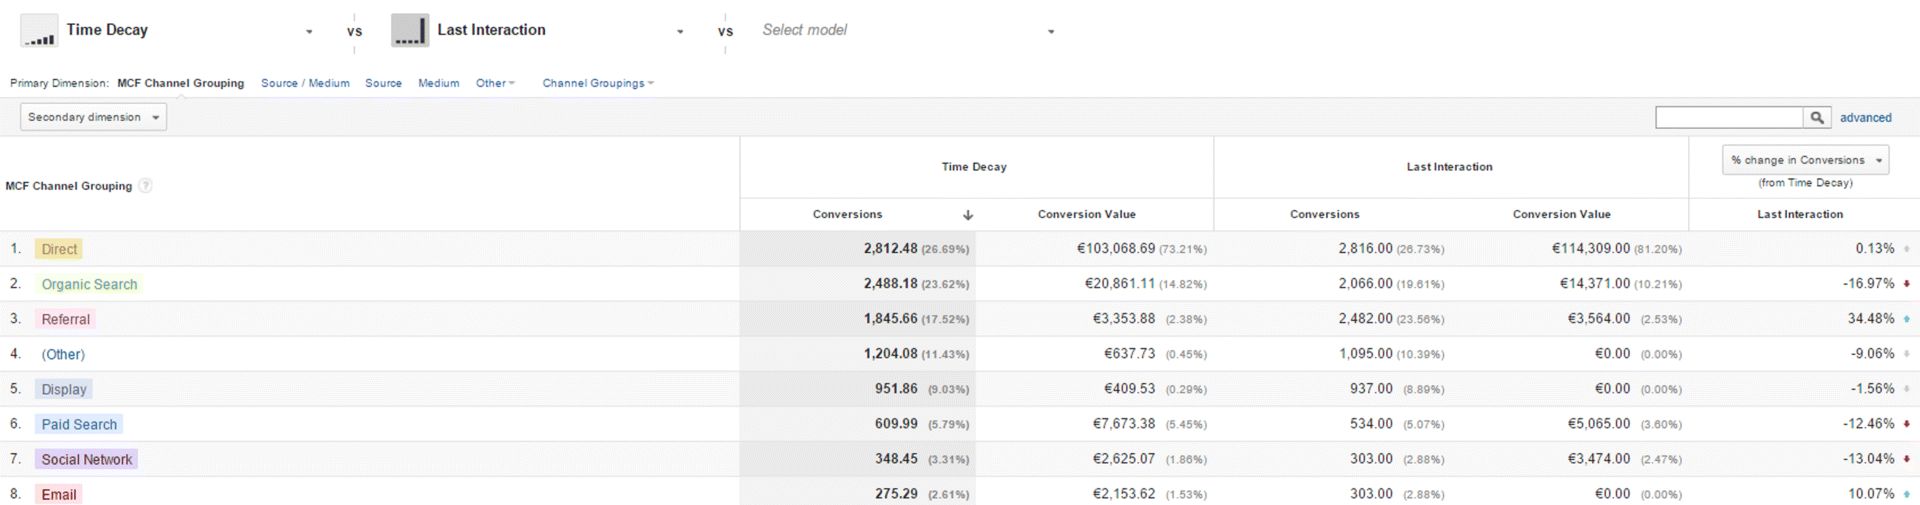
Figure 9.41 Time Decay Attribution Model in GA
Source: Google and the Google logo are registered trademarks of Google Inc.; used with permission.
Attribution values will be dictated by different contexts, KPIs, and products, now examined in more detail in the next section, which looks at customizing GA.
Customization
Having examined the standard GA reports, let's now address how to customize them so that sets of data tailored to a particular business context can be developed. This will show you how to monitor custom reports as defined by your goals in a very specific way.
Once you have read this section you will know:
· Why and when to customize reports.
· How to set up custom reports using the Views and Advanced Segments filters.
· The benefits and limitations of Views and Advanced Segments.
Why Use Customization?
Segmentation helps us to make informed decisions because it lets us make comparisons across areas that matter to the business's needs and goals. Customized reports, such as those shown in Figure 9.42, really drive this—promoting assessment of specific data with the most relevance and leading to clear and actionable insights.
Figure 9.42 List of Customized Reports in a GA Account
Source: Google and the Google logo are registered trademarks of Google Inc.; used with permission.
Views and Advanced Segments
There are three ways to produce custom sets of data using these filters:
1. Drill down. Drilling down is when you combine two different reports in order to compare relevant data. This is relatively self-explanatory; an example would be comparing the behavior of converting females with converting males in order to see how to improve user experience for each gender.
2. Views. Views provide a permanent subset of filtered data. This data is already available in standard reports, but setting up a view simply means you can access it quickly and easily in your dashboard, allowing you to concentrate on the metrics that matter.
A new view is created through the Admin tab that sits above the property. Simply select Create a New View and fill out the filter name in the field, as shown in Figure 9.43.
Views are commonly used to display various time zones around the world (as shown at the bottom of Figure 9.44), so be sure to select the right one, as your time zone setting can't be changed later. Another common use is to exclude internal traffic or to focus on one campaign; for example, filtering for PPC traffic only.
Be very careful with how you filter and be sure to retain one default view that includes all the traffic—you can only apply 25 filters, and they cannot be removed! We have all experienced that stomach-churning sense of doom after realizing that important information has fallen victim to accidental deletion! Also remember that you cannot filter data retrospectively: It will be sorted only from the day you applied the view.
3. Advanced Segments. This is a flexible way of organizing reports, and allows segments to be added and removed as required, and data to be segmented and viewed in a range of directly applicable ways.
The Advanced Segments filter can be applied to any standard report in the form of subsets and can also be added along the top of the screen, as shown in Figure 9.45. The GA interface displays an overview of these segments and provides comparisons between them.
To give an example, a demographic segment could be applied to acquisition reports to compare site traffic coming from the UK, the United States, and Canada. Rich insights can be drawn from comparing data in this way; in this example you might notice, for instance, that while traffic volumes are similar across countries, conversions in the UK are lower, which would suggest that a greater focus on UK audiences is needed.
Figure 9.43 Creating a New View in GA
Source: Google and the Google logo are registered trademarks of Google Inc.; used with permission.
Figure 9.44 Specifying Time Zone for a New View in GA
Source: Google and the Google logo are registered trademarks of Google Inc.; used with permission.
Figure 9.45 Creating Advanced Segments
Source: Google and the Google logo are registered trademarks of Google Inc.; used with permission.
You can set up Advanced Segments in two different ways:
1. Select an existing predefined segment.
2. Create a new unique segment.
Default segments include a wide range of variables, ranging from, for example, conditional circumstances (such as anyone who has purchased in the last 30 days) to basic or advanced demographics. Custom segments can include virtually anything and any number of conditions. Just experiment to create the most useful set of reports!
Be aware that segments are particular to the person who set them up, so no one else will be able to view them unless they are specifically shared. In the case of a company account, for which many people will need access to the segment, the best solution is to create a view and apply a filter instead.
Take advantage of the fact that the reporting options in GA are numerous and gloriously varied; the key is to get creative with the segments you build and the data you compare, all while keeping it relevant and aiming for goal-focused insights.
KPIs
Having so far laid out a solid working knowledge of analytics and an understanding of the depths of reporting available, this final section will explain how to ensure that everything is applied properly.
This is where insights are reviewed, applied to a specific context, and used to meet precise business aims. However, the actual process of setting and using key performance indicators (KPIs) is ongoing and takes something from each stage. By the end of this section, you will understand:
· Why KPIs are a vital element in any campaign.
· Why analytics is important for setting and achieving KPIs.
· Each stage of the four-step KPI iterative process: setting business goals, defining KPIs, analyzing results, and making informed decisions.
Why KPIs?
We've established that business success requires targeted goals, focused actions, and continual evaluation. KPIs, as a set of specific targets, are incredibly important in facilitating this for the following reasons:
· KPIs encourage precise monitoring of a campaign before, during, and after it runs because they provide a numerical target to aim for, a figure to continually benchmark against.
· By analyzing to what extent these numerical targets are or were met and using analytics to answer why, a series of actionable insights can be produced.
· These insights isolate what is working to achieve KPI benchmarks and therefore justify expenses and decisions. The insights gained also highlight necessary marketing and business changes and helps marketers make smarter choices to get there.
Analytics and KPIs
Trying to reach KPIs will dictate analytics reporting, because relevant insights are needed to understand what is working and why. For example, if the aim is to maximize a converting page and there is a specific KPI to meet for that, then analytics reporting would be tweaked to track this at the level of detail required, and used as a basis for informed changes.
In short, KPIs are hard numerical targets, and analytics answer how they can be reached.
The Four-Step KPI Iterative Process
Optimizing analytics to define and meet KPIs is an iterative, ongoing, four-step process:
1. Define business and website objectives.
2. Develop KPIs based on these objectives.
3. Analyze marketing activity using GA.
4. Make informed decisions.
Let's look at each of these steps in detail.
1. Define business and website objectives. There are three layers of detail here: business objectives, business goals, and website goals.
2. The first step is to define wider business objectives, such as an increase in revenue. Next, set a more detailed goal to achieve this objective, such as an increase in the volume of sales. Finally, goals are set for how the website might help facilitate this, such as an increase in conversions.
3. Develop KPIs from these objectives. These basic goals are then clarified into harder targets, using insights and data from analytics reporting. A specific numerical value is assigned to each objective, and KPIs are developed.
4. Continuing with the previous example:
1. Business objective: Increased revenue—an extra $1,000 per month is the aim.
2. Business goal: Increased sales volume—an extra $1,000 is 100 more sales per month.
3. Website goal: Increased conversions—an extra 100 sales equals 100 new conversions.
5. The specific KPIs in this instance would be conversion CPA and conversion rate. The aim is to increase engagement and amount of time spent on site and to lower the bounce rate.
6. Analyze your marketing activity using GA. Having set targets, the next step is to use analytics to report on them. This stage of the process deals with how and why—understanding what is and isn't working within the context of your KPIs.
7. While KPIs deal with the macroconversion (the sale), analytics delves into the finer details and examines the microconversions (the steps that lead to the sale). Microconversions are tipping points along the user journey, such as watching a product video or filling out a contact form. Relevant analytics reports help decipher which microconversions lead to a macroconversion (sale), and crucially, why. This is when analytics becomes very powerful, because if marketers understand the steps that users take before they convert (and likewise, the ones they take before they don't), then the website can be optimized and successes replicated.
8. Make informed decisions. Using this rich knowledge, informed decisions are then made to achieve the KPIs. Action is taken based on the findings, using analytics to tweak strategy.
9. For example, the site could remarket to users who converted previously, or it could target individuals who have performed certain microconversions. By understanding microconversions and the user journey, the site focus can be adapted at specific points along the sales funnel, promoting elements that lead to conversion and improving those that do not. Overall, relatively simple changes can be made based on this information, without altering media spend or AdWords investment.
Of course, these changes should be continually analyzed, assessing whether they help to meet KPIs or not, as part of an ongoing process of refinement.
It is important to use relevant analytics reports to help achieve KPIs—to understand what needs achieving, what is working, what is not working, and how it can be fixed!
So, What Have You Learned in This Chapter?
In this chapter we have looked at the importance of GA, how and why it should be set up, the types of reporting available, and the different methods for drawing perceptive conclusions. Remember that practice makes perfect and keep a few tips in mind for your next GA journey:
· Don't panic—fear not the mind-boggling array of reports, data sets, and customization options. Stick to what is relevant and use only the reports that mean something to the context.
· Use reports wisely! Contrast, compare, and get creative with the segments and the measurement metrics.
· Always develop insights with a view to achieving the business aims.
· Keep asking why! This is how we get the sexy payoffs such as profit, competitive advantage, and slick marketing.

Go to www.artofdmi.com to access the case study on analytics as additional support material for this chapter.
 Exercises
Exercise 1
You would like to be able to view performance in GA for just your PPC traffic. Create a new view from the Admin tab in GA and apply a filter to this view that includes traffic from the medium, CPC. The view will show you only CPC, otherwise known as PPC traffic. Give this view a meaningful name.
Exercise 2
You run a restaurant that takes bookings both over the phone and online. Your online booking process finishes with users landing on a booking confirmation page, which you would like to use to track the number of bookings coming through your site. The request URL of this page is bookingconfirmed.
Create a URL destination goal in your default profile for this online booking, and create a funnel for the steps preceding the goal completion as shown below:
1. Choose date and time: /choosedate.
2. Select number of people: /tablesize.
3. Enter payment options: /payment.
4. Thank you/booking confirmation: /bookingconfirmed.
Exercise 3
Due to budget constraints, your Google AdWords budget has been reduced this year. As a result you have to find ways to reduce spend without impacting performance.
Using the Google AdWords reports under Channels, find the following:
1. Poorest performing keywords.
2. Poorest performing campaigns.
3. Poorest performing time of day.
Use the total number of goal completions as the metric for performance measurement.
Exercise 4
You are the website manager for an online fashion retailer. Despite seeing the same volume of sessions coming through your site, your purchases have decreased significantly over the last quarter.
To understand why this is happening, you need to look at where users are leaving the site. Analyze the following reports:
1. Look at Top Exit Pages (under Behavior) to see where users are most often leaving the site.
2. View the Funnel Visualization report under Conversions to see where users are dropping off on the path to purchasing.
Based on this data decide what action to take and explain your decision.
Exercise 5
Your manager has asked you to report on hourly website sales performance at your weekly Friday morning sales meetings.
1. Create an hour-of-day custom report in GA.
2. Schedule it to be emailed to you on the Thursday of every week so you can prepare in advance of your meeting.
 Action Plan: Analytics
Digital Marketing Planning Scheme for Analytics
Objectives
Conversions, leads, sales, traffic, visibility, brand awareness
Action Items and Frequency
· Keyword research: Quarterly
· Targeting: Monthly
· Scheduling: Weekly
· Bidding and budgeting: Weekly/monthly
· Tracking and reporting: Daily/weekly
Measurement Tools and KPIs
Analytics: e-Commerce transactions, goal completions, traffic share, AdWords sessions, pageviews, new versus. returning visitors
Spend
|
Media |
Content |
People |
Systems |
|
x |
x |
x |