BioBuilder: Synthetic Biology in the Lab (2015)
Chapter 6. Eau That Smell
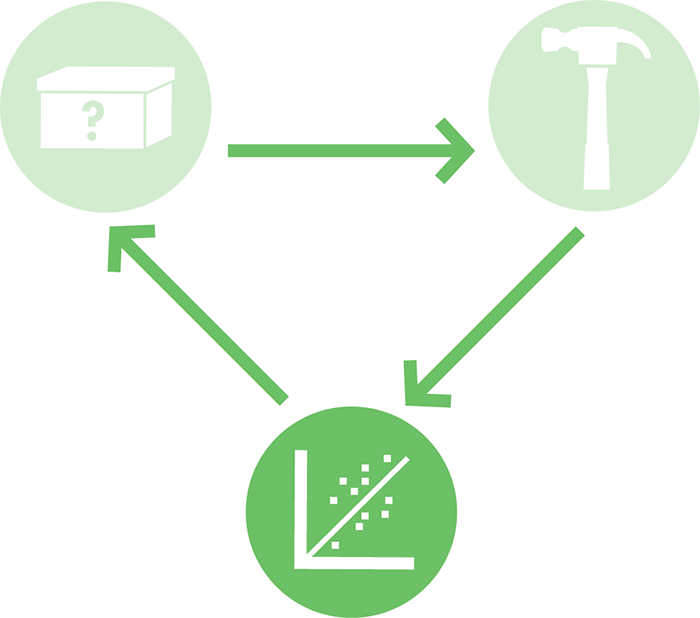
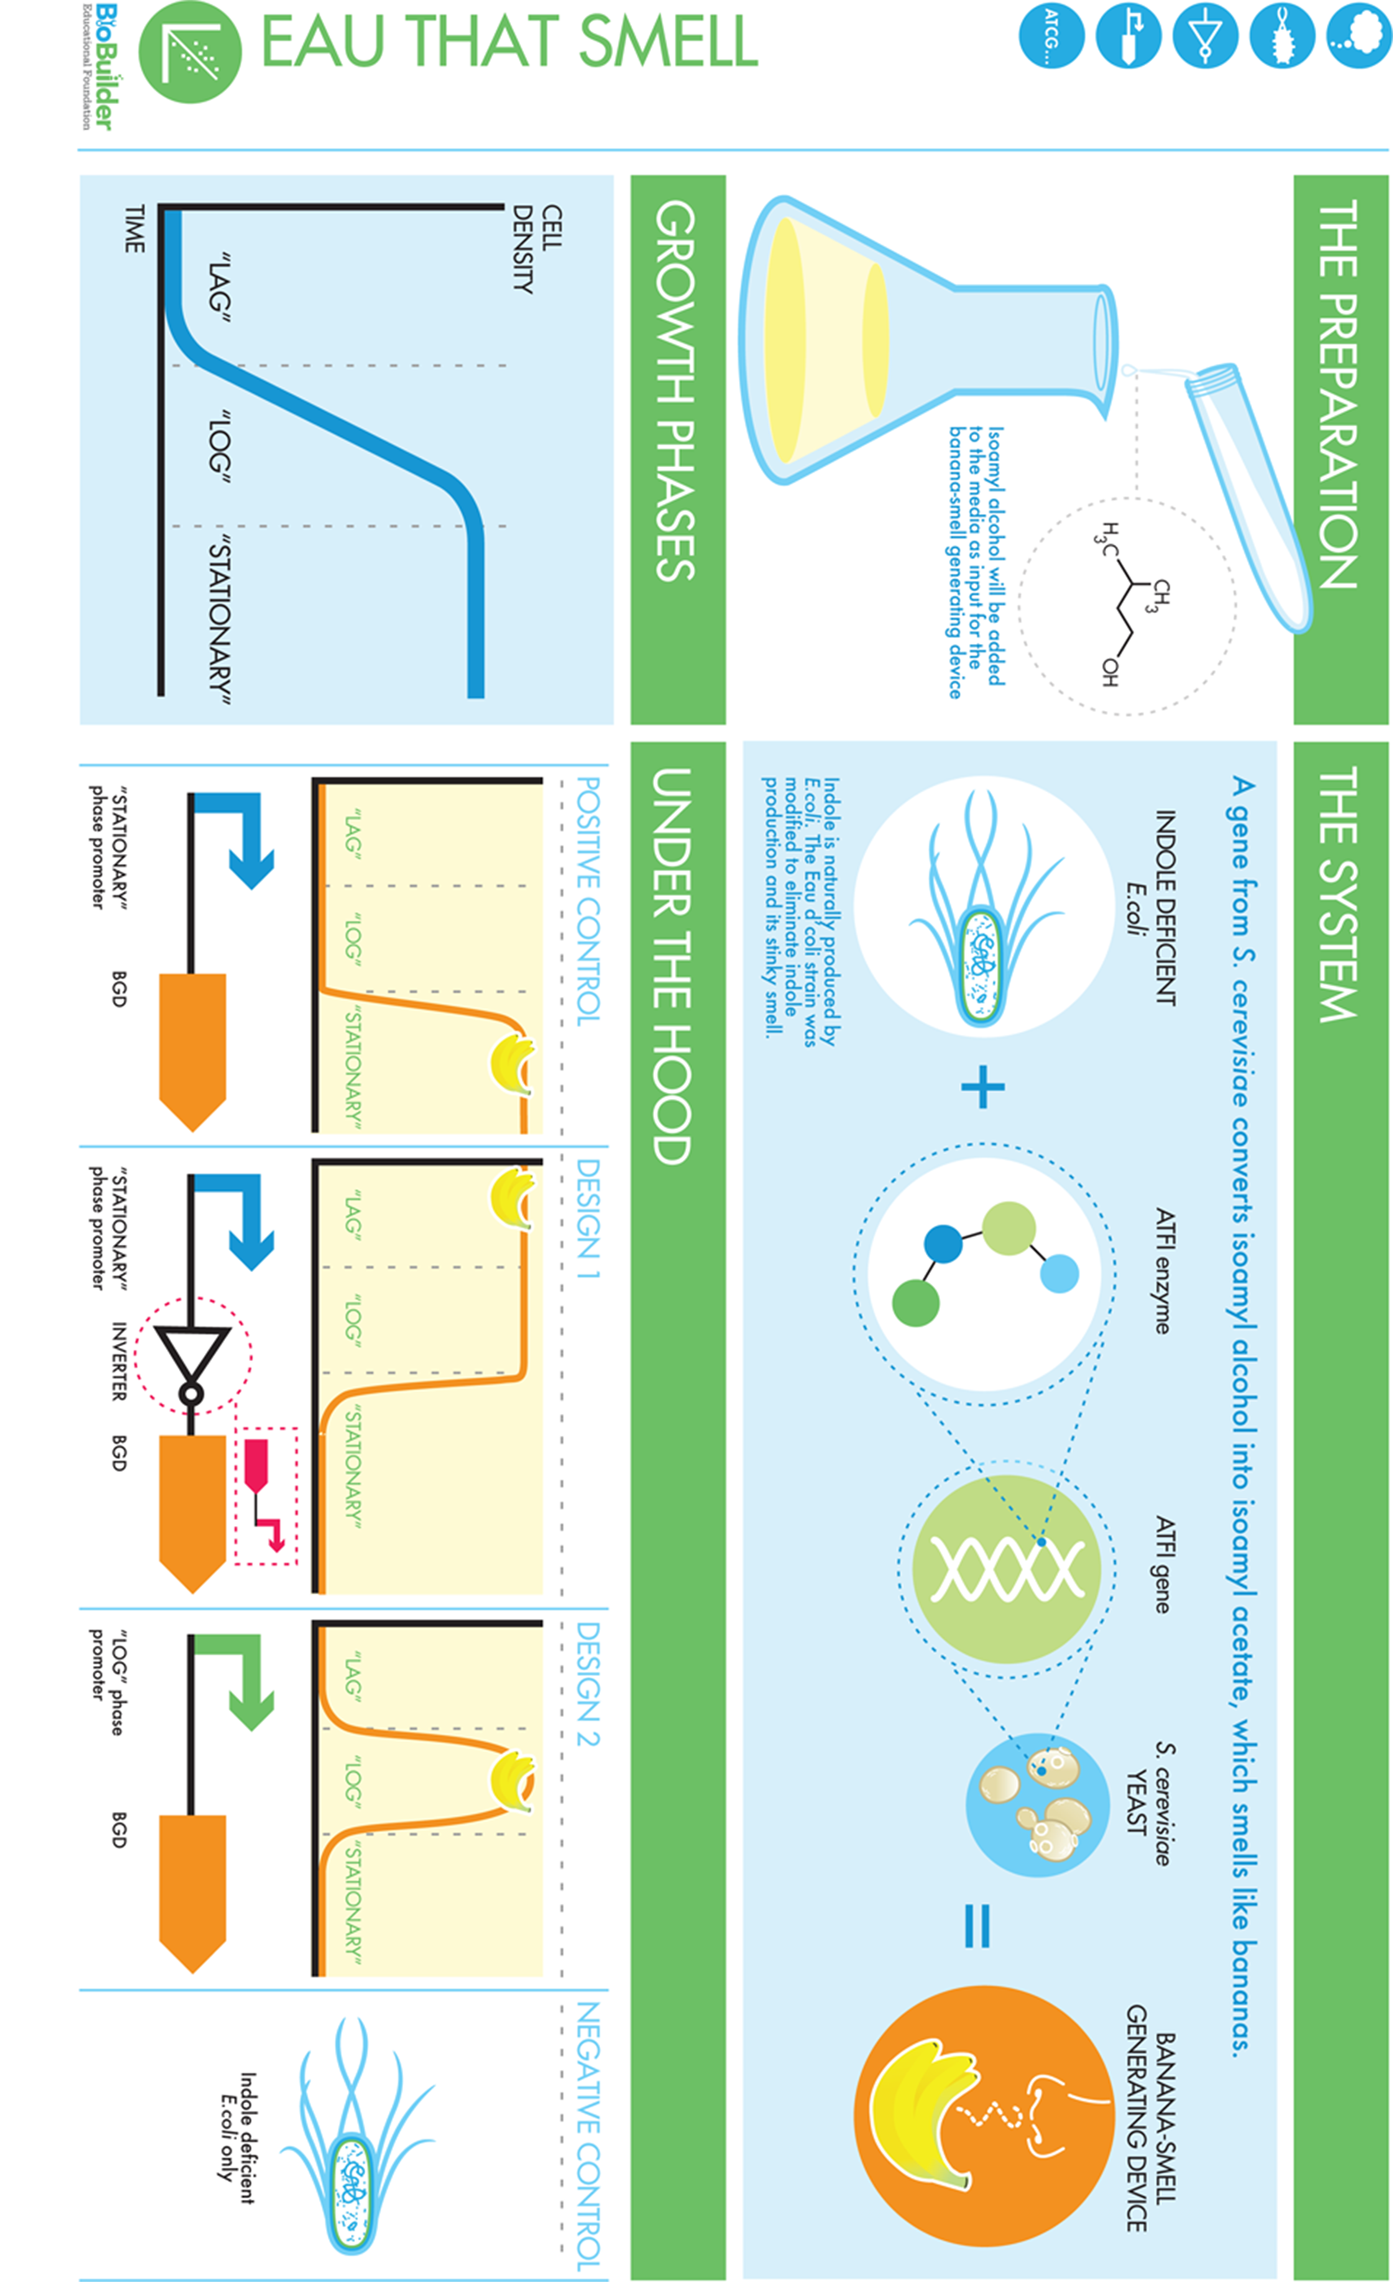
The Eau That Smell lab emphasizes the “test” phase of the engineering design-build-test cycle. You will test two different synthetic living systems, already designed and built by other engineers. There are two design options for you to compare. Both of these designs change the smell of normally stinky bacteria, and both look like they could be “right.” In comparing the designs, there will be opportunities to explore how synthetic biologists make design choices as well as to learn and teach some important scientific ideas about gene regulation and cell growth. This activity was inspired by an International Genetically Engineered Machines (iGEM) project from 2006 in which a team of undergraduates from MIT designed a new strain of bacteria they called “Eau d’coli.” The team generated a strain of E. coli that smells like bananas or wintergreen, depending on the growth phase of the cells. The BioBuilder laboratory activity looks at two genetic programs that control the relationship between cell-growth cycle and scent generation. On paper, the two design options appear nearly equivalent, but real-world behavior often deviates from expectations, so the laboratory activity allows for direct testing of the strains described here. Before detailing the experiment, we will walk through the iGEM project on which it’s based to offer context, and also to provide an illustration of the design process, including the use of abstraction, design hierarchies, and iteration.
Inspiration from the Eau d’coli iGEM Project
By exploring how the 2006 MIT iGEM team reached its final design and built its synthetic system, we’ll illustrate the design process as well as provide some background on how cell growth and gene expression are normally regulated. The Eau d’coli example also opens up nice opportunities to discuss the use of cells as factories to make materials (ones that smell nice, in this case) and precursor-product relationships, as well.
Identify a Challenge

The team behind the Eau d’coli project started with a very simple observation: E. coli smell really bad. The smell is a problem because many synthetic biologists use microbes to produce molecules such as drugs and other desirable compounds. Using E. coli as tiny chemical factories requires large vats of stinky bacteria that end up making the labs smell bad, too. So the iGEM team thought: why not engineer a strain of E. coli that smells nice instead?
Brainstorm Solutions
After the iGEM team identified the problem it wanted to address, it considered various solutions. Two options that were identified involved either getting rid of the naturally occurring bad smell or introducing a new, more pleasant scent. The team initially decided to introduce a new scent rather than just get rid of the naturally occurring scent, the thought being that the bad smell arose from a variety of metabolic pathways and compounds and thus would be tricky to eliminate completely.
System-Level Design

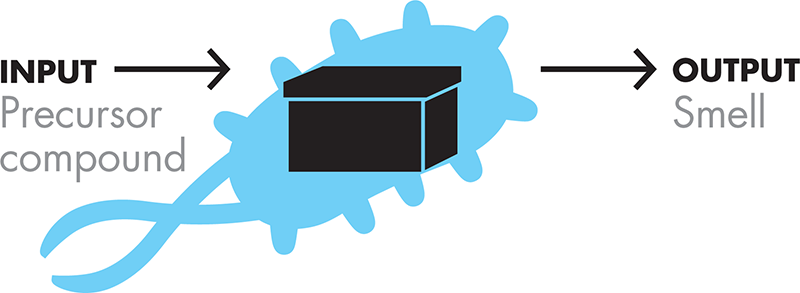
At this point, the team was ready to specify a system-level design. In plain language: the bacteria would take as input some precursor compound that could be converted by the cell into a nice smelling output.
In designing its system, the iGEM team had to think about which type of cell or organism to use. Because the team wanted E. coli to produce a pleasant smell that could overpower its natural stink, the obvious choice was to work in E. coli. However, there were a number of strains to choose from and, as we’ll see, the team had to make some later adjustments to the chassis before its final system could be built.
Device-Level Design

With the specification of the system-level design complete, the team began thinking about its devices. First, clearly the team needed some type of smell-generating device that would turn a nonsmelling precursor compound into a smell. Team members searched the scientific literature and identified five naturally occurring metabolic pathways that satisfy this requirement. All of these enzymatic pathways could convert a specific precursor compound into a product that had a pleasant smell. The pathways the team considered using included a jasmine scent from the model plant Arabidopsis thaliana, a cinnamon scent from a basil cultivar, a “fresh and floral” scent from snapdragon flowers, a wintergreen scent from a bittercress plant, and a banana scent from yeast, Saccharomyces cerevisiae.
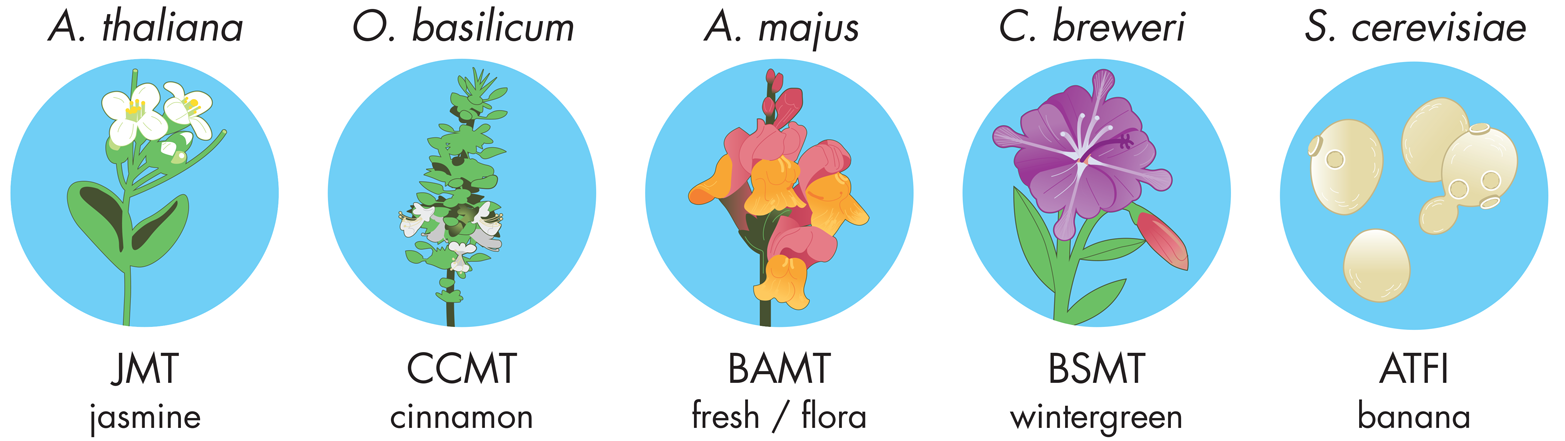
In theory, the team could have moved forward with any of these devices, but before continuing the design process, it was important to narrow down the options with some initial experiments to confirm that it was possible to isolate the devices in question and that the devices generated the desired smells. You might think that conducting tests at this early stage is a violation of the design-build-test cycle because the team was still in the “design” phase, but in fact it can be quite useful to move between these phases when needed. In this case, the team was essentially working through a minimal design-build-test cycle for each potential device to test whether it was heading in the right direction, rather than completing an entire design around devices that might never actually be functional.
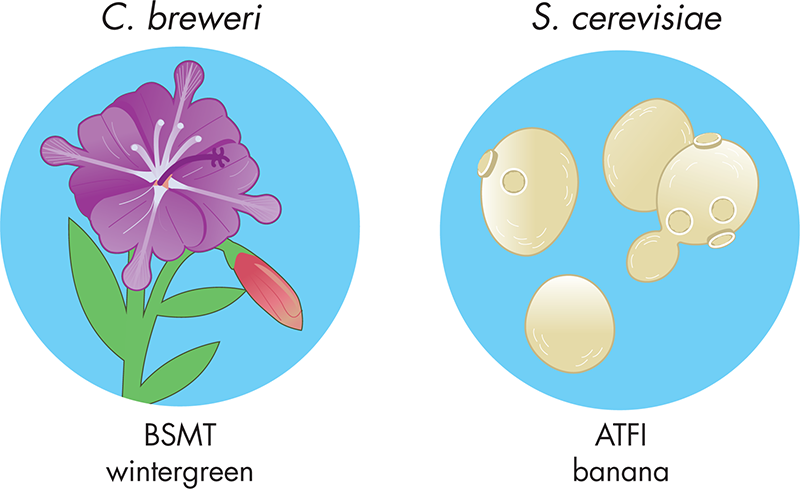
Through these initial experiments, the team was unable to isolate the DNA responsible for the jasmine and cinnamon scents—in other words, it got blocked at the “build” phase of the cycle, making it impossible to continue with these devices—and in the “test” phase the scent that the literature reported as “fresh and floral” was closer to cherry cough syrup, which was not a desirable smell for a lab. Therefore, the team’s initial experimentation left two remaining device options, devices that generated wintergreen and banana aromas. Figure 6-1 shows what the team’s device-level design looked like.
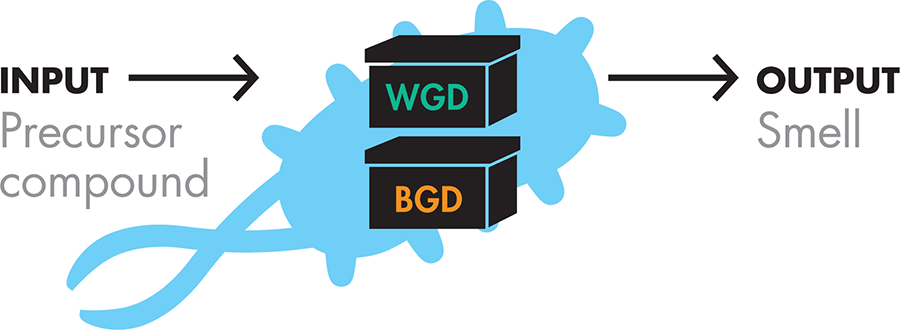
Figure 6-1. Device-level design. The wintergreen-generating device (WGD) converts a precursor compound input into wintergreen smell output. The banana-generating device (BGD) converts precursor input into banana smell output.
From here, the team could have continued to the parts-level design work to specify these devices, but instead the team saw an opportunity to improve the system-level design, namely to redesign the system so that it could switch between the two smell-generating devices. This revision of the system-level design wasn’t an indication of any failure or shortcoming in the initial design. This type of movement between the different abstraction levels is integral to the design process.
System-Level Design, Revised

With the two smell-generating devices in hand, the team realized that, in addition to its original goal of making a better-smelling bacteria, scent might be used as a reporter for a cellular function. Many synthetic biology reporters are visual—green fluorescent protein (GFP) is a favorite—but there might be some applications for which a scented reporter would be more appropriate.
The team decided that it wanted to use scents as reporters for the cells’ growth, so the cells would have one smell when they were actively growing and dividing, and another smell when they reached their maximum density. Bacterial cells growth follows a characteristic pattern, which is shown in Figure 6-2.
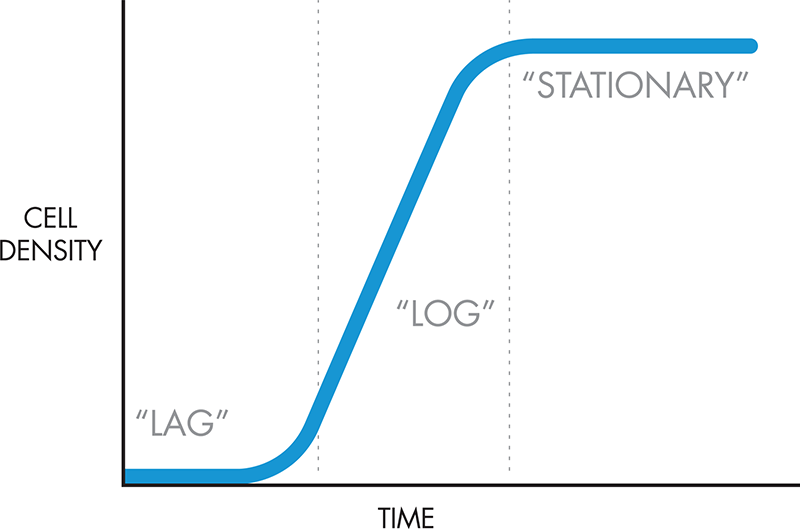
Figure 6-2. Cell growth curve. Cell density, as measured by spectrophotometer or another method, plotted as a function of time, with the boundaries between regions corresponding to the three bacterial growth phases—lag, log, and stationary—shown with dotted lines.
When cells are initially introduced to fresh media, they spend time in a lag phase, during which they acclimatize to the new environment and are not actively growing or dividing. The number of cells in solution does not increase dramatically during this phase, so the growth curve is flat during this time. After the cells have been primed for growth during this lag phase, they enter log phase, also called the exponential phase, during which they grow and divide very quickly. E. coli grown in the lab at 37°C can double about every 30 minutes. As they divide, they use the nutrients in the media and secrete waste products that inhibit growth, which eventually causes them to enter the third growth phase, the stationary phase, at which point they are no longer growing or dividing. The cells at this stage are still alive, and when a sample is diluted into fresh media, the entire growth curve from lag to log to stationary phase can begin again.
Researchers growing E. coli in the lab often need to monitor these phases as they conduct their experiments. For example, when E. coli is being used to produce a fine chemical or a drug, productivity is often highest the stationary phase. Protein products, by contrast, are typically growth-associated, and so cells should be kept in log phase of growth as much as possible to produce the greatest amount of the desired compound. Traditionally researchers determine the growth stage of their experimental cells using a spectrophotometer, an instrument that will measure the amount of light passing through a sample. The difference between the amount of light that enters the sample and the amount of light that exits is called the optical density of the sample. Bacterial cells will scatter the incoming light when the spectrophotometer is set to a 600 nm wavelength, so the sample’s population can be measured as the “OD600,” for the optical density of the sample in 600 nm light. Based on changes of OD600 over time, it’s possible to create a growth curve such as the one presented in Figure 6-2, where time is displayed along the x-axis and cell density is on the y-axis. However, not every lab has a spectrophotometer, so it could be very useful to have another growth phase indicator that doesn’t rely on an expensive instrument—for example, scent.
With this in mind, the iGEM team modified the project’s system-level design, as shown in both Figure 6-3 and Figure 6-4.
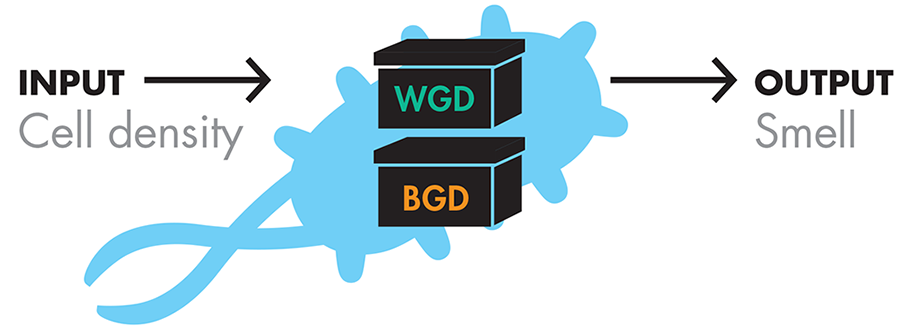
Figure 6-3. Revised device-level design. A new input, cell growth, requires revising the original device-level description of the system.
Figure 6-4. Smell-generating devices responding to cell-growth phase. The system’s two smell-generating devices are shown. They are sensitive to and operate during particular phases of cell growth.
Note that the input now is the cell-growth phase, not the precursor compound. The team still needed to define the project’s system-level design a little further to determine what the cells should smell like at what point during the growth curve. It had two scents and three growth phases. Because the log and stationary phases are usually most relevant to researchers, the team decided that these two phases should be the ones to have scents. During its initial experiments, the team found that the wintergreen smell was weaker than the banana smell, so it decided that the best solution was to make the cells smell like wintergreen during log phase and then switch to the banana scent at stationary phase. In this way, the stronger banana scent would be detectable above any remaining wintergreen scent.
Device-Level Design, Revised
With this new plan in place, the iGEM team also needed to revise the project’s device-level design. In the original design, the devices converted a nonsmelling precursor compound to a smell. With the new design, an additional step was needed. The cells now had to generate the precursor compounds that would feed into the smell-generating devices to produce the wintergreen and banana aromas. Here, again, a review of the scientific literature was critical. The precursor for the wintergreen device was known to be a molecule called salicylic acid, and the precursor for the banana device was known to be isoamyl alcohol. Devices were needed to produce these precursor compounds in the cell, so the updated device list (Figure 6-5) included a salicylic acid-generating device and an isoamyl alcohol-generating device.

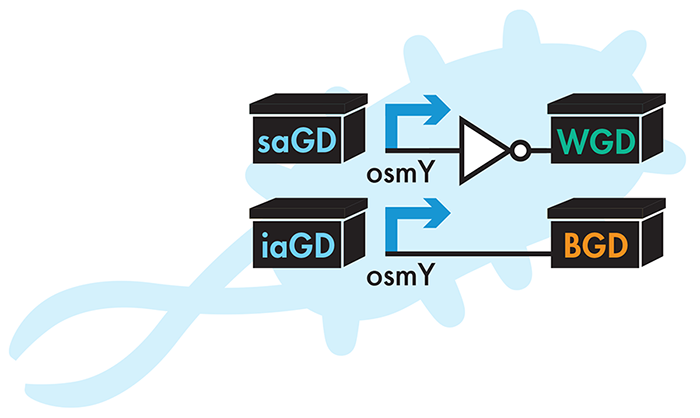
Figure 6-5. Re-revised device-level design. The new device-level design includes two additional devices, a salicylic acid-generating device (saGD) and isoamyl alcohol-generating device (iaGD).
Here, you can see an analogy between the design for the arsenic sensor from the arsenic-detecting system that is extensively discussed in the Fundamentals of Biodesign chapter. That arsenic-detecting system also included two devices: the arsenic-detecting device and the color-generating device. The designers of that system could have combined these two functions into a single device, but such a design would have made it more difficult to reuse any of the parts. A similar principle is in play for the design of this scent-generating system. It’s theoretically possible to make a single device that could translate the cell-growth phase into one of two smells, but the flexibility and modularity of the design are enhanced by breaking the system into multiple devices.
You might notice that we have not yet specified which of the devices is sensitive to the cell-growth phase. It would be possible to design the system so that the precursors were only made at particular growth stages or to design the system so that the precursors were always made and only the smell-generating devices were sensitive to the growth phase of the cell. There are advantages for each of these design choices. Smells might be generated faster if the precursors were always made and the smell-generating devices were regulated. On the other hand, it might increase the metabolic strain on the cell to always make the precursors, and in this way might affect the health of the cell or impact other functions. Clearly, there’s no single right or wrong answer at this point; rather, as a biobuilder, there are choices to make. In this instance, the iGEM team chose to regulate the smell-generating devices according to growth phase and to produce the precursor compounds constitutively.
Parts-Level Design
With this device-level specification in hand, the parts-level design phase can begin.
One of the first things to consider is how to detect the cell’s growth phase, which is a key input for the system. Luckily, biology provides a naturally occurring solution. Bacterial promoters exist that are only active at certain stages of the cell-growth cycle. When the bacterial RNA polymerase molecule binds a promoter to start transcription, it does this as a holoenzyme, in which a core unit of the polymerase combines with a specialized subunit called the sigma subunit of RNA polymerase. The sigma subunits come in several “flavors”—for example, σ70 subunits that bind to the DNA sequences that are typical for log-phase promoters, and σ38 subunits that bind to the DNA sequences associated with stationary-phase promoters. The MIT iGEM team searched the literature for a promoter sequence that’s active only during the cell’s stationary phase of growth and found the “osmY” promoter. The team inserted this promoter into the banana smell-generating device so that device would only be active during stationary phase, as the team defined in the project’s system-level design specifications.
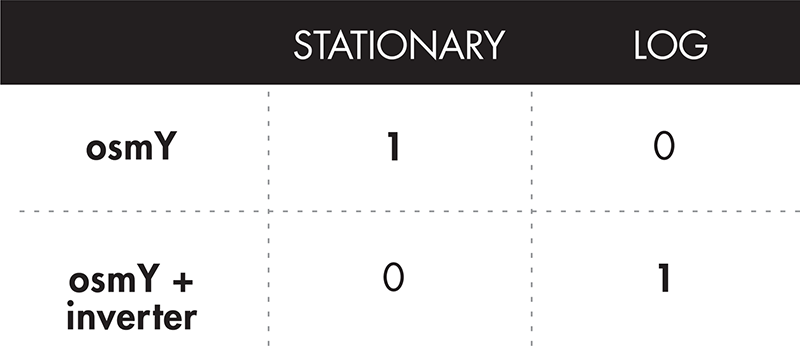
To build the device for the log-phase expression of the wintergreen smell-generating device, the most straightforward approach might be to find a promoter that’s only active during log phase of growth. However, the MIT iGEM team that year chose a different solution: it used the same osmY promoter that it had used for the banana-smell generating device and added another device between the osmY promoter and the open-reading frame that encodes the enzyme to make the wintergreen smell. The device the team chose to use is called an inverter or a NOT logic gate. The truth tables and underlying genetics of inverter devices are explored in the upcoming sidebar “Inside the Black Box”. But even without a mechanistic understanding of how it works, it can be a useful building tool. An inverter will reverse its input. If the osmY promoter should be “on” (as it would be in stationary phase), the osmY promoter combined with an inverter turns the downstream part “off” in stationary phase. If the cells are in lag or log phase, when the osmY promoter is normally off, the osmY promoter plus an inverter device makes the downstream part turn “on” in these cell-growth stages, as illustrated in Figure 6-6.
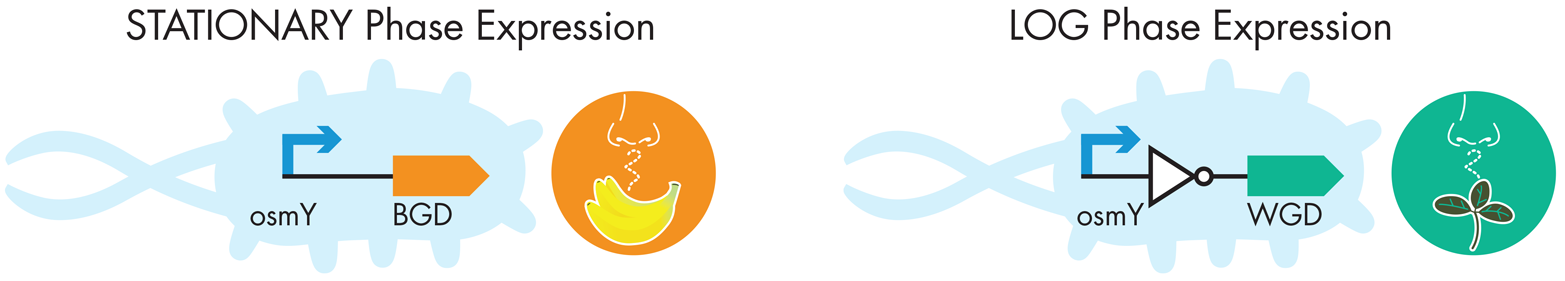
Figure 6-6. Parts-level design. The osmY promoter upstream of the BGD result in banana smell generation during stationary phase. The osmY promoter followed by an inverter (the white triangle with a circle at the tip) upstream of the WGD result in wintergreen smellgeneration during log phase.
So on paper, it makes sense that the iGEM team might have used the osmY promoter for expressing the banana smell during stationary phase, and the osmY promoter plus an inverter to express the wintergreen smell during log phase. But you might wonder: won’t the wintergreen smell also be present during the lag phase? Is that useful? Is that a problem? Are there even enough cells present during this lag phase to make a noticeable amount of smell? Maybe it would have been better for the iGEM team to have chosen a log-phase promoter for the wintergreen smell. All these questions really boil down to this: how precise does the smell regulation need to be to meet the system specifications?
In the BioBuilder lab activity associated with this chapter, this design decision is directly explored by collecting smell and cell-growth data at the bench.
INSIDE THE BLACK BOX
If you search the Registry of Standard Biological Parts, you’ll find any number of inverter devices. Most of them use transcriptional repression to implement the NOT gate logic. In general terms, these inverter devices are composed of several simple parts beginning with a repressor protein such as a lambda repressor, lac repressor, or tet repressor followed by a repressible promoter that’s recognized by the encoded repressor protein, for example, a lambda phage promoter when a lambda repressor is used. If an inverter device is placed between another promoter and its open reading frame (ORF), activation of the upstream promoter now triggers expression of the repressor protein, which recognizes the downstream promoter directing transcription of the ORF, blocking its expression. As a result, the system’s expression pattern is precisely opposite to its behavior in the absence of the inverter.
In the system we’ve been considering here, an inverter was placed between the osmY promoter and the ORF that encodes the wintergreen smell-generating protein. Thus, when the cell is in stationary phase, the osmY promoter is active and so it expresses the inverter. The repressor protein that’s encoded by the inverter is produced, and that repressor binds to the downstream promoter that’s also included in the inverter. The repressed promoter limits transcription of the ORF that’s downstream of the inverter, which is the wintergreen smell-generating protein in the Eau d’coli system. Consider the reverse scenario: when the cells are in log phase, the osmY promoter is not active, the repressor protein encoded by the inverter is not produced, and the promoter directly upstream of the wintergreen smell-generating ORF is active, so the wintergreen scent is produced.

Figure 6-7. Unpacking the inverter. Details for two part-level designs. The stationary-phase promoter, osmY, is the first component of each device. In the banana-generating system it is directly upstream of the BGD and so produces banana smell in stationary phase. In the wintergreen smell-generating device, the osmY promoter is followed by an inverter, which is itself composed of a repressor and a promoter directing the WGD. This should produce a wintergreen scent when the cells are NOT in stationary phase.
There are a number of such naturally occurring repressor-repressible promoter pairs (like lambda, lac, or tet) that designers can use, each with slightly different behavior. When designing new systems, the choice of which inverter to use can depend on a number of things. Sometimes, an inverter that can (or can’t) be further regulated with external chemical inputs is desirable. For instance, a lactose analog called isopropyl β-D-1-thiogalactopyranoside (IPTG), can be used to de-repress the lac repressor protein, and thus if an inverter is built with that protein, the logic can be switched by the addition of IPTG to the growth media. Sometimes, the choice of inverter will depend on other things already built into the system. For instance, if you’re already using the lac repressor to carry out some other genetic task in the cell you’re building, it might be a poor choice for the inverter function, as well. Finally, although all inverters reverse the logic of an input/output relationship, they might do so with different kinetics (faster/slower) and efficiencies (80 percent off versus 95 percent off at steady state), which might be relevant considerations for your design. The Registry of Standard Biological Parts has tried to characterize the behavior of different inverters under different conditions, but given how many possible systems can be built with them, there is still a considerable amount of the “try it and see” approach before synthetic biologists can know if the inverter they’ve selected will work well for the system in question.
Final Device and System-Level Edits
For the salicylic acid-generating device, the iGEM team identified a pathway from the model plant Arabidopsis thaliana that converts chorismate, a naturally occurring compound present in E. coli, into salicylic acid. Similarly, for the isoamyl alcohol-generating device, the team identified a pathway from yeast, S. cerevisiae that converts the amino acid leucine into isoamyl alcohol. The smell-generating devices work on the salicylic acid and isoamyl alcohol to convert them to nice smelling compounds. Salicylic acid is converted to methyl salicylate, which smells minty, and isoamyl alcohol is converted to isoamyl acetate, which smells like bananas.
And though it seems like at this point the project’s specification is complete, there is, in fact, one final design choice to point out. When brainstorming ideas as described at the very beginning of this chapter, the iGEM team was considering either adding a nice smell or removing the nasty one from E. coli. It turns out that the strain generating both the banana and the wintergreen smell still had problems from the natural stink of the chassis. Thus, the team decided to make one more system-level design change. Specifically, it decided to use a strain of E. coli that is deficient in indole production. Indole is one of the main compounds responsible for the bad E. coli smell. This indole-deficient chassis is not completely stink-free and it’s not the perfect chassis for all applications, but in this case, working with a less smelly strain made the newer scents far easier to detect.
Additional Reading and Resources
§ Dixon, J., Kuldell, N., Voigt, C., ed. BioBuilding: Using Banana-Scented Bacteria to Teach Synthetic Biology. Burlington, Mass.: Academic Press 2011; Methods in Enzymology;Vol. 497:255-71. [ISBN: 978-0-12-385075-1].
§ Madigan M.T., Martinko J.M., Parker J., eds. Brock Biology of Microorganisms, Prentice-Hall, 2000:135-62. [ISBN: 978-0321649638].
§ Website: Bacterial Growth Curves (http://bit.ly/bacterial_growth_curves).
§ Website: Registry of Biological Parts (http://parts.igem.org/Main_Page).
§ Website: Yale Coli Genetic Stock Center, indole deficient strain: (http://bit.ly/e_coli_resources).
Eau That Smell Lab
This lab provides an effective introduction to microbial growth and population dynamics as well as to the proteins and DNA sequences needed to express a gene (promoters, ORFs, RNA polymerase, and so on). The engineering concept of abstraction is also emphasized through the analysis of two competing designs. Finally, biotechnology skills such as sterile technique, standard curves, and spectrophotometric analysis are embedded in the work.
Design Choices
In our discussion of the Eau d’coli project, we saw that the iGEM team made a number of design choices, including the following:
§ Using growth phase as the input and smell as the output
§ Deploying naturally occurring biological pathways from other organisms to generate banana and wintergreen scents
§ Making the smell-generating devices (and not the precursor-generating devices) sensitive to the growth phase
§ Using a stationary-phase promoter and a genetic inverter rather than a stationary-phase promoter and a log-phase promoter
If we had the time, we could explore each of these design choices. For example, we could experiment with environmental cues other than cell-growth phase as inputs. We could experiment with color rather than scent as the system’s output, or we could test how the system would respond if the precursor-generating devices were responsive to growth phase rather than the smell-generating devices. As a starting point, though, we will investigate the use of a genetic inverter to control the system. The other previously listed ideas could be great follow-up experiments if you have the time or interest.
With this experiment, we will investigate the growth and smell patterns produced when the banana smell-generating device is controlled by a log-phase promoter versus a stationary-phase promoter and an inverter. Both of these designs are expected to produce the banana smell during log phase, but one design might have advantages over the other. For example, the log-phase promoter might remain slightly active even when the cells begin to enter stationary phase, whereas the inverter-based design might be active in the lag phase of the growth curve, as well. Which will give the most intense banana smell in log phase is anyone’s guess, and until the computer-aided design tools for synthetic biology mature, the best way to evaluate these system designs is to do an experiment. Hopefully by characterizing each system’s performance, we will be equipped to apply these findings to future designs.
Experimental Question
This investigation retains some of the elements of the iGEM Eau d’coli system but deviates in important ways that help focus the experimental question to the use of promoters and inverters. The experiment here uses the same chassis the iGEM team did, which is indole-deficient, and the same banana smell-generating device, including the team’s osmY promoter. Some crucial differences from the iGEM system, though, include the following:
§ No wintergreen smell: we are investigating the relative effectiveness of different promoter choices, so the competition between different smells is not relevant, and the banana smell is stronger, so it makes the most sense to use it for our tests.
§ No precursor-generating device: we will be adding the precursor compound directly to our growth culture, which will allow us to focus on our question about the promoter choice by minimizing possible variability introduced by the precursor-generating devices.
We provide four different E. coli strains for this experiment, which are listed in Table 6-1.
|
Strain # |
Plasmid name or registry # |
Plasmid description |
|
1-1 |
BBa_J45250 |
σ38-controlled promoter directing transcription of ATF1, AmpR |
|
1-2 |
BBa_J45990 |
σ38-controlled promoter plus 4-part tetR inverter directing transcription of ATF1, AmpR |
|
1-3 |
BBa_J45200 |
σ70-controlled promoter directing transcription of ATF1, AmpR |
|
1-4 |
pUC18 |
AmpR |
|
All strains are constructed in the chloramphenicol-resistant, indole-deficient strain, NB370 (aka YYC912 from the Yale Distribution Center), of genotype: F- Δ(argF-lac)169 λ- poxB15::lacZ::CmR IN(rrnD-rrnE)1 rph-1 tnaA5 |
||
|
Table 6-1. Eau That Smell strain descriptions |
||
Strain 1-1 serves as a positive control for the banana smell, and it is identical to the strain developed by the 2006 iGEM team that makes the banana smell during stationary phase. The positive control should be a strain from which we expect to smell bananas independent of our specific experimental question. In this case, we are using a strain of E. coli that smells like bananas during stationary phase using the stationary-phase promoter. If this strain smells, we can be confident that our reagents and protocols are all functioning properly, allowing us to eliminate possible variables that are not part of our experimental question.
Strain 1-4 serves as a negative control because it does not carry the genes required to make the banana smell and so is not expected to smell like bananas. In this experiment, our negative control strain is the same chassis used to make the other strains but contains no banana smell-generating device. We can use this strain to make sure that, for instance, simply adding the precursor compound to growing cells is not responsible for the banana smell generated by the experimental strains.
The negative control strain is a negative control for banana scent, because it is not expected to smell like bananas, but it is also possible to consider it a positive control for cell growth, because it is expected to grow. Because it lacks a banana smell-generating device, this strain might be used to ask, “do strains containing a banana smell-generating device change the rate of cell growth?” This is not our primary experimental question, but it could be important for considering the next stage of design optimization.
The last two strains are the experimental strains, and they represent the two designs we want to compare:
§ Stationary-phase promoter + inverter + banana smell-generating device (strain 1-2)
§ Log-phase promoter + banana smell-generating device (strain 1-3)
By comparing these two seemingly equivalent designs, we can ask the experimental question: does a log-phase promoter design or a stationary-phase promoter plus an inverter design provide better log-phase-specific banana smell?
Getting Started
You will culture these four strains in liquid media. At different points during growth, you will measure the cell density, either using a spectrophotometer to measure the OD600 or using the McFarland Turbidity Scale. By graphing the cell density over time, you will be able to determine the growth phase of the samples. For each cell-density measurement, you will also smell the samples, recording the intensity of banana smell relative to a set of standards that range from no banana smell, which we call “smell standard 0” to an intense banana smell, which we call “smell standard 7.” The standards are prepared using varying concentrations of banana extract, which has the chemical name isoamyl acetate. The range for the banana standards was developed to span the expected smells you’ll detect from the bacterial cultures. By matching a culture’s scent to a particular standard, you can get an idea of the concentration of isoamyl acetate being produced. These smell measurements will make it possible for you to determine which promoter construct offers better control of the banana smell as a function of the growth phase.
Advanced preparation
Prepare banana smell standards
Banana extract has the chemical name isoamyl acetate. You can prepare the smell standards as indicated in Table 6-2, adding the extract to water using the 50 ml conical for each standard. You can use distilled or bottled water to make the standards and you can use the markings that are on the side of the tubes to approximate the final 25 ml volume. Samples will spoil over time but last approximately one month at room temperature.
|
Standard |
Concentration (%) |
Extract in H20 (final volume 25 ml) |
|
0.1 |
25 μl |
|
|
0.25 |
62.5 μl |
|
|
0.5 |
125 μl |
|
|
250 μl |
||
|
2.5 |
625 μl |
|
|
1.25 ml |
||
|
Table 6-2. How to prepare smell standards |
||
NOTE
The banana extract is an oil and will not dissolve in water. However, the concentrations are low and as long as the standards are given a shake before smelling, a suspension is sufficient.
Prepare turbidity standards
The MacFarland turbidity standards presented in Table 6-3 offer an alternative way to measure cell density for cases in which you are running the protocols without access to a spectrophotometer. This method uses suspensions of a 1% BaCl2 in 1% H2SO4 that are visually similar to suspensions of the density of E. coli as it grows in liquid culture. These turbidity standards can be prepared well in advance of lab. The turbidity standards can be made in any volume but then should be suspended and aliquoted to small glass tubes with a cap. The size of the tubes and the volume of the standards you put in them doesn’t matter.
|
Turbidity scale |
OD600 |
1% BaCl2/1% H2SO4 (mL) |
|
0.0/10 |
||
|
0.1 |
1.05/9.95 |
|
|
0.2 |
0.1/9.9 |
|
|
0.4 |
0.2/9.8 |
|
|
0.5 |
0.3/9.7 |
|
|
0.65 |
0.4/9.6 |
|
|
0.85 |
0.5/9.5 |
|
|
1.0 |
0.6/9.4 |
|
|
Table 6-3. MacFarland turbity standards |
||
To measure the turbidity of the bacterial samples, you can transfer a small sample of the bacteria to a glass tube that is the same size as the ones used for the turbidity standards. The turbidity is determined by identifying which turbidity standard comparably obscures dark markings placed behind the tubes with the standards.
Rule of thumb: use 1 OD600 ~ 1 x 10⁹ cells/ml to convert the turbidity measurements to cell density.
Pre-lab procedures
Day 1: streak out strains from stabs to plates
The bacterial strains for this experiment already carry the plasmid DNA-encoding genetic circuits to be tested. The plasmids also confer resistance to the antibiotic, ampicillin. The bacteria will arrive as a “stab” or “slant,” which is a test tube with a small amount of bacteria on a slanted media.
1. Streak out the bacteria onto a Petri dish using a sterile toothpick or inoculating loop. Gather a small amount of bacteria from the stab on the toothpick or loop, and then transfer the cells to a petri dish containing Luria Broth (LB) agar plus 100 μg/ml ampicillin.
2. Repeat with the remaining stab samples, streaking out each onto a different petri dish.
3. Place these petri dishes media side up in a 37°C incubator overnight. If no incubator is available, a room-temperature incubation for two nights will usually yield the same result.
Day 2: grow liquid overnights of bacterial strains
To make a starter culture for the experimental section of this lab, a 3 ml liquid culture of each strain is grown in LB+ampicillin at 37°C overnight. The final concentration of ampicillin in the tubes should be 100 μg/ml. A 3 ml starter culture is enough for the protocols that follow. Using a sterile inoculating loop or toothpick or pipet tip, transfer a bacterial colony from one of the petri dishes to a large sterile culture tube containing 3 ml of LB and 3 μl of ampicillin. This volume is more than enough for each strain that each student or team of students must grow:
1. Repeat for each strain you will inoculate.
2. Place the culture tubes in the roller wheel in the incubator at 37°C overnight. Be sure to balance the tubes across from each other to minimize stress on the roller wheel.
3. Cultures are stable and active for at least a week when stored in the refrigerator. If you store them this way, expect them to take considerably longer to begin growing on the day you subculture; expect on the order of ~3 hours rather than 1.5.
If there is no roller wheel or incubator available, you can increase the volume for each starter culture to 10 ml LB+amp, and grow the samples in small Erlenmeyer flasks with a stir bar at room temperature. They should be grown this way for at least 24 hours to reach saturation.
Lab Protocol
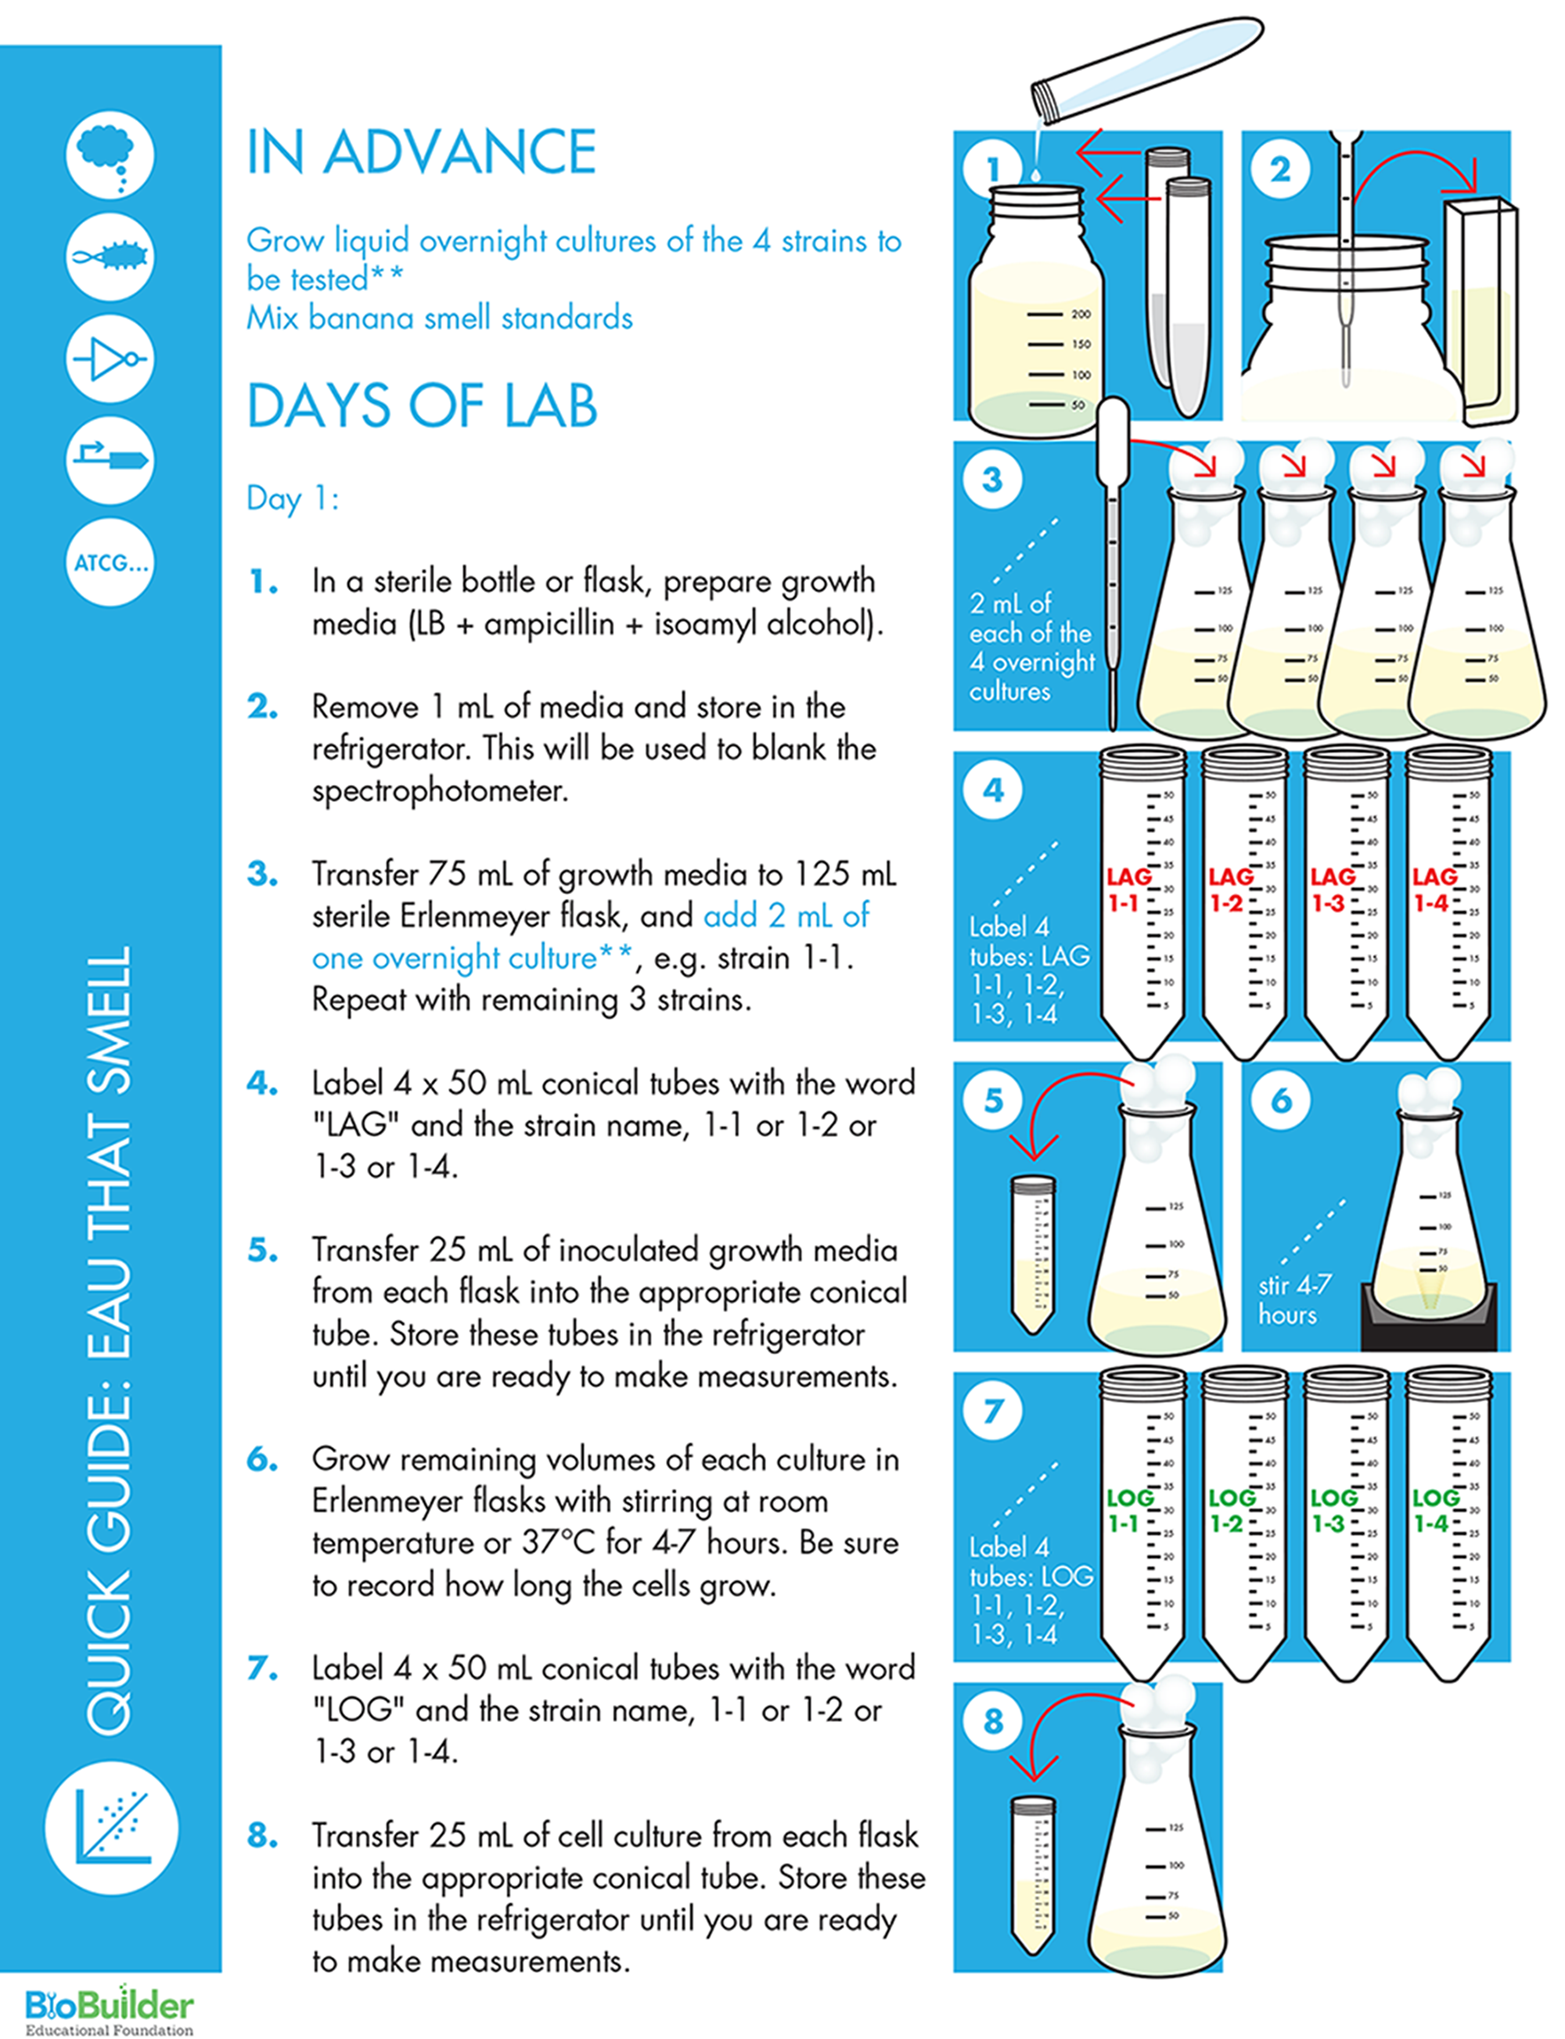
This is a shorter version of the protocol that emphasizes data analysis over data collection. The BioBuilder website also provides a longer version of the protocol that emphasizes growth-curve data collection. Here, large volumes of bacterial cultures are set up one day prior to any data collection. The samples are then ready the following day, allowing for data-collection data in single lab period.
The protocol assumes that everyone will measure all four bacterial cultures at each of the three time points and that large volumes of bacterial cultures are to be shared. The 75 ml cultures should be sufficient for up to 12 lab groups, assuming that each group takes only one time point.
On the day before data is to be collected, do the following:
1. Prepare the growth media using the following:
o 300 ml LB
o 300 μl ampicillin (final concentration of 100 ug/ml)
o 250 μl isoamyl alcohol
2. Mix this stock growth solution by swirling the bottle.
3. If you will be using a spectrophotometer to collect data, set aside 2 ml of this mixture to serve as the blank for the spectrophotometer. Store this aliquot of media in the refrigerator.
4. Move 75 ml of the growth media to 125 ml sterile Erlenmeyer flask, and then add 2 ml of bacteria from one of the overnight starter cultures, for example, strain 1-1.
5. Repeat the addition of 2 ml of bacteria to 75 ml of growth media in an Erlenmeyer flask for each of the overnight cultures.
6. Label four 50 ml conical tubes: label each tube T(LAG) and indicate the bacterial strain (for example, 1-1).
7. Remove 25 ml from culture 1-1 and place in the appropriate conical tube and store in the refrigerator. This will serve as the lag-phase sample you will read on the data collection day.
8. Repeat the previous step for each culture.
9. Cover the Erlenmeyer flasks with foil and start them gently stirring on the stir plates for 6-8 hours. This is done at room temperature. Record the time each culture began spinning. Note that you also can grow the samples at 37°C, in which case the time it will take to reach the next growth phase will be shorter, ~4-5 hours.
10.Label four 50 ml conical tubes: label each tube T(LOG) and indicate the bacterial strain (for example, 1-1). Record the number of minutes since the culture began stirring.
11.Remove 25 ml from culture 1-1 and place in the conical tube and store in the refrigerator. This will serve as the log-phase sample you will read on the data collection day.
12.Repeat the previous step for each culture.
13.Allow the remaining bacterial cultures to incubate overnight on the stir plates at room temperature or at 37°C if you have been growing them that way. These will serve as the stationary-phase samples you will read on the data collection day.
NOTE
You can store samples in the refrigerator for one to two weeks at this point.
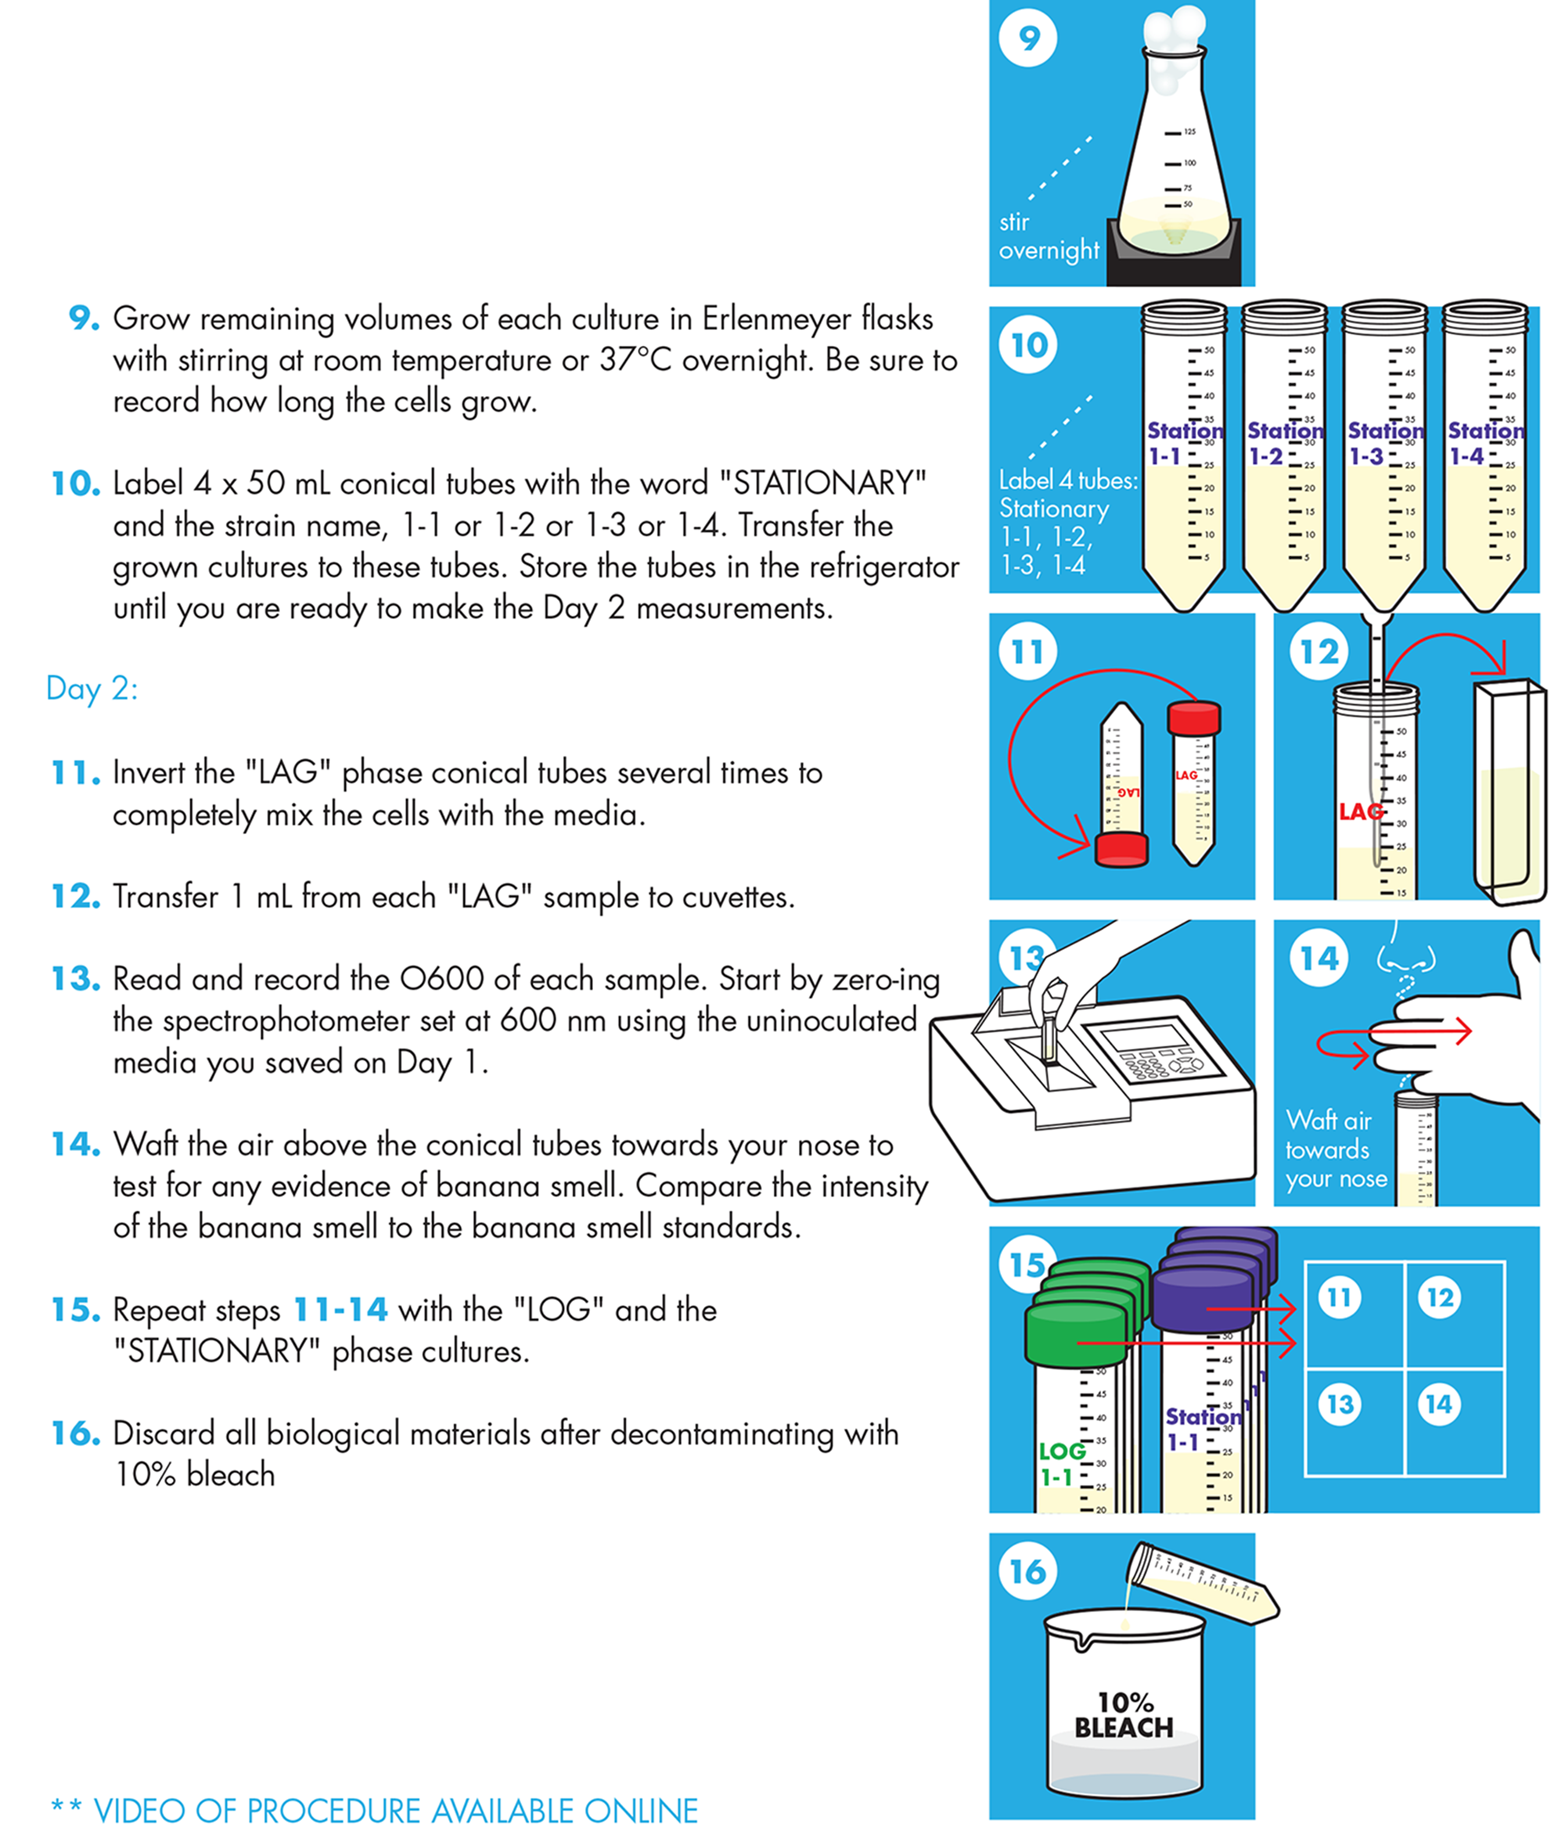
Data collection: turbidity using a spectrophotometer
1. Vortex or invert each tube if the bacteria have settled at the bottom of the 50 ml conical tubes.
2. Remove 2 ml from each lag sample to read the density of each. If you are collecting data for all four lag-phase samples, you should now have five small test tubes, four with bacterial samples and one to blank the spectrophotometer.
3. Prepare the spectrophotometer by setting it to OD600.
4. Read the blank and adjust the % absorbance to zero.
5. Read the turbidity of the bacterial samples and record the absorbance.
6. Calculate the bacterial population: 1 OD600 unit = 1 x 10⁹ bacteria.
7. Repeat this data collection with the log- and stationary-phase bacterial samples.
Data collection: turbidity using turbidity standards
1. Vortex or invert each tube if the bacteria have collected at the bottom of the 50 ml conical tubes.
2. Remove 2 ml from each lag sample to read the density of each. If you are collecting data for all four lag-phase samples, you should now have samples in four small test tubes. The tubes should match the tubes that hold the turbidity standards.
3. Place the samples and the turbidity standards in a test tube rack that allows you to view the liquid samples from the side. On a blank index card or paper use a marker to draw two thick black lines. These lines should be within the height of the standards.
4. Place a white card with parallel black lines behind the tubes.
5. Compare the bacterial cultures to the standards by looking for a standard that most similarly obscures the black lines on the background card.
6. Use Table 6-3 to convert the turbidity standard to an OD600 value, and then use the simple conversion factor of 1 OD600 unit = ~ 1 x 10⁹ cells/ml to calculate cell density.
7. Repeat this data collection with the log and stationary-phase bacterial samples.
Data collection: banana smell
1. Vortex or invert each tube if the bacteria have collected at the bottom of the 50 ml conical tubes. Warming the tubes to room temperature or 37° will make the scents easier to detect.
2. Sniff the 50 ml conical tubes for any evidence of a banana smell, comparing the smell with the banana extract standards. Be sure to shake the standards before sniffing. Record your data.
3. Repeat the preceding steps with the log-phase samples and then the stationary-phase samples.
NOTE
The banana smell can dissipate while the tubes are open. Keep the tubes closed as much as possible and, if needed, shake them to bring back the smell.