Stock Investing For Dummies, 5th Edition - Paul Mladjenovic (2016)
Part IV. Investment Strategies and Tactics
IN THIS PART …
Use powerful stock screening tools to unearth great stock picks.
Discover how brokerage orders can help you maximize profits and minimize losses (even in bear markets).
Get the scoop on how to automate your trade orders so you can make money while you’re asleep on vacation.
Understand how to buy top stocks for as little as $50 (and no brokerage commissions).
See how insiders trade so you can have a profitable edge in the markets.
Find out how you can keep the tax bite on your profits to a minimum.
Chapter 16. Discovering Screening Tools
IN THIS CHAPTER
Beginning with the basics of screening tools
Locating stocks with stock screeners
Finding exchange-traded funds (ETFs) with an ETF screener
When you’re spanning the stock-investing world, it can be daunting to see literally thousands of stocks to choose from — and that’s just the U.S. stock markets. Many thousands more are across the global stock market realm. Where would a stock investor (especially a novice investor) begin to look?
Well, you’re doing the right thing by first reading a book like this (thank you and, uh, you’re welcome!). Why? Because a book like this gives you some parameters and guidelines to help you make a sound choice among the companies that are available as publicly traded stocks. As I often emphasize, you may be purchasing a stock, but you’re really investing in a company. That company has financial data and other information that you can review and narrow your search by keeping to some definable (and searchable) standards.
This is why I love stock screening tools! A stock screening tool is an online program found on many financial websites and brokerage sites that sifts through tons of stocks and their relevant data (profits, sales, and so on) with parameters that you set. It works like a search engine but within a huge closed database that is regularly updated with public company data. You’ll find one or more stocks that fit the parameters you set.
In this chapter I provide the most common parameters for tools that screen stocks and exchange-traded funds (ETFs). But first, I give you some basics about these tools. Keep in mind that with these tools, you’re looking for companies based on your search criteria. You can find stocks and ETFs based on a variety of critical standards and metrics that you define and set.
 For some great sites that have stock screening tools (especially for fundamental analysis), check out the following:
· Yahoo! Finance (http://finance.yahoo.com)
· MarketWatch (www.marketwatch.com)
· Nasdaq (www.nasdaq.com)
Understanding the Basics of Screening Tools
After you familiarize yourself with the components and practicality of stock screening tools, you’ll be hooked and you’ll wish that you had used them sooner. In the following sections, I break down the essentials.
Choosing the category
The first thing you typically see with a stock screening tool is the category. Actually, this means the industry (see Chapter 13 for an introduction to industries). Many screeners (such as the one at Yahoo! Finance, http://finance.yahoo.com) go into sub-categories. If you’re looking for a transportation company, for example, you may get “transportation-trucking,” “transportation-rail,” and “transportation-shipping.”
Distinguishing “min” versus “max”
Min and max are the yin and yang of the stock screening world. When you set your parameters for stocks, you need to set a minimum and a maximum. If, for example, you’re looking for a “profitable stock,” that means you need to set a parameter of minimum profit and maximum profit. The stock investor takes the long view and stays patient and focused for successful value investing (find out more about this topic in Chapter 8).
 Keep in mind that some stock screeners use a different approach, such as “less than” and “greater than,” but it essentially serves the same purpose for your searches.
Setting value ranges
In some cases, you may need to choose a range. Perhaps you’re looking for stocks in a particular price range. A stock screening tool may provide choices such as 0-10, 10-20, 20-30, 30-40, 40-50, and over 50. Another typical range you may see is market capitalization (the total market value of the company’s stock) or dividend yields (the dividend amount divided by the stock price).
Searching regardless of your entry
Most screening tools allow you to do a search whether you enter one value or parameter or many. If you choose to search for a stock in all categories and enter only, say, a dividend yield with a minimum value of 2 and a maximum value of 999 and no other entries, then you’ll get hundreds of stocks.
However, if you input plenty of parameters, then you’ll get very few stocks (or none at all). If you ask for stocks with features A, B, C, D, and E, then you won’t get as many results. Be selective — that’s the whole point of using stock screeners — but don’t go overboard trying to find the perfect stock because it may not exist.
Getting close to perfection is probably good enough, but the more important point is to avoid the bad choices such as companies that have too little income, have net losses, or carry too much debt.
Touring a Stock Screening Tool
Most stock screening tools have some basic elements that are very useful in helping you narrow your search for the right stocks in your portfolio. Figure 16-1 shows a typical stock screener from Yahoo! Finance (https://screener.finance.yahoo.com/stocks.html); the following sections walk you through the fields of this tool.
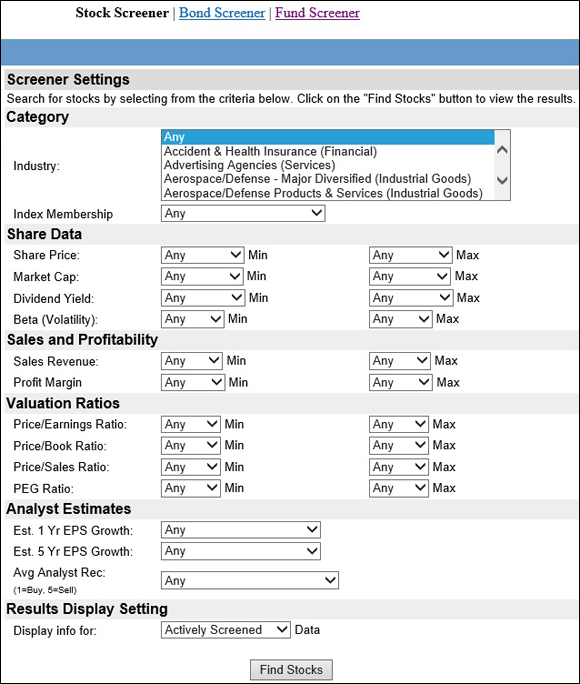
Source: Yahoo! Finance
FIGURE 16-1: A typical stock screening tool.
Keep in mind that with the minimums and maximums in the following sections, there will be variations. Some stock screening tools allow lower minimums and higher maximums than the Yahoo! tool. Also, some market analysts and financial advisors are more or less lenient than I am with these numbers. Don’t sweat it. Do your research and come up with similar numbers that you’re comfortable with.
Category
In this opening choice in your stock screener, choose the industry (or sector) in which you’re looking for a stock. This is important because the industry is part of what makes the stock successful. Even if you choose a mediocre stock but it’s in a strong or growing industry, you can still do well.
A sector is a group of interrelated industries. For example, the healthcare sector has varied industries such as hospitals, medical device manufacturers, pharmaceuticals, drug retailers, and so on. Choosing an industry instead of a sector narrows your choices. Flip to Chapter 13 for more information on sectors and industries.
Share Data
In this field, you enter data about the stock to refine your search.
Share Price
Are you looking for an inexpensive stock that’s under $10 per share? If so, you’d enter $0 as the minimum share price and $10 as the maximum share price. At this level, you may end up with a small cap stock that may be too risky for you, so make sure you check out the next section.
If the share price isn’t a material concern, then you’d enter $0 as the minimum share price and put a large number, such as $999, in the maximum share price field so that you’d essentially be searching all stocks without concern to share price.
Market Cap
As you find out in Chapter 1, market capitalization (or market cap) is a reference to a company’s market value (calculated as share price times total shares outstanding). A small cap stock has a market cap of under $1 billion, so if you’re interested in such a stock, you’d enter a minimum capitalization of $0 and a maximum of $1 billion.
If you’re more risk-averse, then you’d set the criteria for a large cap stock and put in a minimum of, say, $10 billion.
Dividend Yield
This field is perfect for those looking for dividend income (covered in Chapter 9). In general, dividend-paying stocks that are referred to as income stocks tend to have a dividend yield that exceeds 3.5 percent (some say that the range is 3 to 4 percent). For the maximum entry, you’d put in an inordinately high number such as 999 percent.
If the dividend yield isn’t an issue for you (because you’re looking for growth stocks, for example), then you’d leave this blank.
Beta (Volatility)
Are you looking for stocks that are very volatile, or do you prefer stable, boring stocks? No matter which, it’s good to know the beta of a stock. Beta (which I discuss in Chapter 4) measures the volatility of a stock against a standard of the general stock market, such as the S&P 500. The market is assigned a beta of 1.0. If a stock is twice as volatile as the general stock market, it will have a beta of 2.0. If it’s 2.5 times as volatile as the stock market, it will have a beta of 2.5, and so on. If the stock has a beta of .80 (under the market’s 1.0), then it’s 20 percent less volatile than the general stock market (you get the picture).
Therefore, if you want a feature of low volatility in your search parameters, you’d enter a minimum beta of 0 and a maximum beta of either 1.0 or a lower beta as you see fit.
If you were a speculator and you were trading options, then a high volatility feature would be important to you. You might choose a minimum beta of 2.0 and put in the maximum beta of, say, 999. Imagine if you did find a stock with a beta that high — you’d be in volatility heaven!
Sales and Profitability
After choosing the industry (which I cover earlier in this chapter), the most important aspect is the sales and profitability. The net profit is the single most important metric when analyzing a company.
Sales Revenue
For sales revenue, there may be absolute numbers or percentages. In some stock screeners, there may be ranges such as “under $1 million in sales” up to “over $1 billion in sales.” On a percentage basis, some stock screeners may have a minimum and a maximum. An example of this would be if you wanted companies that increased their sales by at least 10 percent. You’d enter 10 in the minimum percentage and either leave the maximum blank or plug in a high number such as 999. Another twist is you may find a stock screener that shows sales revenue with an average percentage over three or five years so you can see more consistency over an extended period.
Profit Margin
Profit margin is basically what percent of sales is the company’s net profit. If a company has $1 million in sales and $200,000 in net profit, then the profit margin is 20 percent ($200,000 divided by $1,000,000).
For this metric, you’d enter a minimum of 20 percent and a maximum of 100 percent because that’s the highest possible (but improbable) profit margin you can reach.
Keep in mind that the data you can sift through isn’t just for the most recent year; some stock screeners give you a summary of three years or longer, such as what that company’s profit margin has been over a three-year period, so you can get a better view of the company’s consistent profitability. The only thing better than a solid profit in the current year is a solid profit year after year.
Valuation Ratios
For value investors (who embrace fundamental analysis), the following parameters are important to help home in on the right values. (Check out Appendix B for more details on ratios.)
Price/Earnings Ratio
The P/E ratio (price-to-earnings ratio) is one of the most widely followed ratios, and I consider it the most important valuation ratio (and it can be considered a profitability ratio as well). It ties the current stock price to the company’s net earnings. The net earnings are the heart and soul of the company, so always check this ratio.
All things being considered, I generally prefer low ratios (under 15 is good, under 25 is acceptable). If I’m considering a growth stock, I definitely want a ratio under 40 (unless there are extenuating circumstances that I like and that aren’t reflected in the P/E ratio).
 Generally, beginning investors should stay away from stocks that have P/Es higher than 40, and definitely stay away if the P/E is in triple digits (or higher), because that’s too pricey. Pricey P/Es can be hazardous, as those stocks have high expectations and are very vulnerable to a sharp correction. In addition, definitely stay away from stocks that either have no P/E ratio or that show a negative P/E. In these instances, it’s a stock where the company is losing money (net losses). A company that’s losing money means that buying the stock is not investing — it’s speculating.
Make sure your search parameters have a minimum P/E of, say, 1 and a maximum of between 15 (for large cap, stable, dividend-paying stocks) and 40 (for growth stocks) so that you have some measure of safety (or sanity!).
If you want to speculate and find stocks to go short on (or buy puts on), two approaches apply:
· You can put in a minimum P/E of, say, 100 and an unlimited maximum (or 9,999 if a number is needed) to get very pricey stocks that are vulnerable to a correction.
· A second approach is putting in a maximum P/E of 0, which would indicate that you’re searching for companies with losses (earnings under zero).
Keep in mind that shorting is risky and is a form of speculating (see Chapter 17 for the scoop), so the safer and more assured route is investing in stocks tied to quality, profitable companies for the long term.
Price/Book Ratio
A major valuation is the price-to-book (P/B) ratio. This compares the price of the stock (market capitalization) to the net asset value (or “book” value) of the underlying company. Ideally, the ratio should be 1-to-1, where the market value and the book value are at parity, but you won’t usually find that. Just know that the closer the market value is to the book value, the better the value. A P/B ratio of under 4 is optimal; if it’s higher, it’s getting too pricey.
A market value that’s much higher than the book value may indicate an overvalued stock, so tread carefully here. In the stock screener’s P/B ratio field, consider entering a minimum of 0 but making the maximum 4, because buying a stock whose market capitalization is four times greater than the company’s book value is getting pricey.
Price/Sales Ratio
In terms of calculation, this ratio is similar to the P/B ratio in the preceding section, but just substitute the book value with the total annual sales. Again, a price-to-sales (P/S) ratio close to 1 is positive. When market capitalization greatly exceeds the sales number, then the stock leans to the pricey side.
In the stock screener’s P/S field, consider entering a minimum of 0 or leave it blank. A good maximum value would be 3.
PEG Ratio
You obtain the PEG (price-to-earnings growth) ratio when you divide the stock’s P/E ratio by its year-over-year earnings growth rate. Typically, the lower the PEG, the better the value of the stock. A PEG ratio over 1.00 suggests that the stock is overvalued, and a ratio under 1.00 is considered undervalued. Therefore, when you use the PEG ratio in a stock screening tool, leave the minimum blank (or 0), and use a maximum of 1.00.
Other valuation ratios
Some stock screeners may include other ratios. One good one is the average five-year ROI (return on investment), which gives you a good idea of the stock’s long-term financial strength. Others may have an average three-year ROI.
Because this is an average (percentage terms) over five years, do a search for a minimum of 10 percent and an unlimited maximum (or just plug in 999 percent). If you do get one that’s anywhere near 999 percent, by the way, call me and let me know!
Analyst Estimates
The Yahoo! stock screener has a category called “Analyst Estimates” just in case you want to screen stocks based on the “buy, sell, or hold” views of widely followed analysts. This can add another helpful filter to your searches.
You can check out what analysts expect in terms of earnings per share (EPS) growth for either one or five years. If you’re looking for strong earnings growth for potential investing, use a minimum of, say, 15 percent so you find companies that have strong earnings growth (put “up more than 15%” in the entry field). If you’re bearish and looking to go short companies with falling earnings, put in a negative such as “down more than 10%.”
For average analyst recommendations, you can put in a range of 1 to 5, where 1 is a strong buy rating and 5 is a strong sell rating. This way, you can use analyst views to further filter the results you’re looking for in order to make more confident buy or sell decisions.
SCREENING STOCKS WITH TECHNICAL ANALYSIS
Earlier in this chapter, I use criteria and financial data (the “fundamentals”), but many stock screeners have the ability to use technical analysis (see Chapter 10 for details) by using technical indicators. Technical analysis is more important for those with a short-term focus, such as stock traders and short-term speculators. Here are some common technical indicators:
· Moving averages: Looking for stocks that are trading above their 50-day moving average or have fallen below it? How about the 200-day moving average, which can be a more reliable indicator of the stock’s near-term strength (or weakness)?
· Relative Strength Index: The RSI is one of my favorite technical indicators. It basically tracks a stock in terms of being overbought or oversold in the near term. If a stock has an RSI of over 70, then it’s overbought, and the stock is vulnerable to declining in the near future. A stock with an RSI under 30 is considered oversold, and that’s potentially an opportunity for the stock to rally in the near term.
Don’t use the RSI to determine what to buy, but certainly consider it as a way to time a purchase (or sale). In other words, if you’re attracted to a stock and want to buy, consider getting it in the event that it’s oversold. That gives you the chance to get a stock you want at a favorable price.
When you do your search and you’re using the RSI as one of your criteria, consider using a maximum RSI of 50, which is essentially in the middle of the range, with a minimum RSI of 0. If you’re looking to speculate by going short, make sure your minimum RSI is 70 and the maximum is unlimited.
Here are some popular screening tools online for technical analysis:
· StockCharts (www.stockcharts.com)
· StockFetcher (www.stockfetcher.com)
· Market In & Out (www.marketinout.com)
Checking Out an ETF Screening Tool
In addition to stock screeners, there are also screeners for bonds, mutual funds, and now exchange-traded funds (ETFs; see Chapter 5). Figure 16-2 is a typical ETF screener like many online.
Courtesy of ETFdb.com
FIGURE 16-2: A typical ETF screening tool.
With ETF screeners, you won’t find minimum and maximum as much as with stock screeners. There are more varied categories to filter through and different performance criteria. The following sections cover the main categories.
Keep in mind that most of the popular financial sites (such as Yahoo! Finance and MarketWatch) have good ETF (as well as stock) screeners; most of the stock brokerage sites have search and screening tools as well. Some other popular sites that have ETF screening tools include the following:
· ETF Database (www.etfdb.com/screener)
· ETF Table (www.etftable.com)
· ETF Screen (www.etfscreen.com)
Asset class
An ETF is a conduit. When you buy an ETF, you’re really buying what’s in the ETF’s portfolio. The portfolio has assets, and you need to choose what assets you want to find with the ETF screener. The major choices are
· Stocks: Within the stocks category are sub-categories ranging from small caps to large caps to preferred stocks. Yet another filter in the mix is whether the stocks pay dividends.
· Bonds: Bonds are a form of debt, and there are different classes of debt, so there are different bond ETFs to choose from. There are bond ETFs that have investment grade bonds (with A or better bond ratings, although some consider BBB the minimum investment grade), and there are high-yield bonds (translation: lower-rated or low-quality “junk” bonds).
· Commodities: Typically, these ETFs have futures contracts covering the range of commodity choices. There are ETFs in grains, base metals, energy, and so on.
· Currencies: These ETFs have futures contracts covering currencies ranging from the U.S. dollar to virtually any major currency that trades on global markets.
· Options: There are few (if any) ETFs that are purely into options, but some ETFs do have an exposure to options as part of their total portfolio, so see if this fits your goals.
· Other assets: As more ETFs are created, more will have alternatives such as real estate and mortgages. There are even ETFs that have a portfolio of … other ETFs!
Keep in mind that the stock screening process can drill down and help you peruse ETFs in other categories such as preferred stocks, equity, and so on.
Geographic area
Do you want to invest in ETFs that are tied to a geographic area? Maybe you want to invest in India, Africa, or Canada. Maybe the Pacific Rim interests you, or maybe you think that Europe is primed to do well. Many ETF screeners have geographic search criteria.
Inverse and leveraged ETFs
ETFs can make money when stocks or other assets go up, but there are also inverse ETFs that are designed to go up when the underlying assets go down. If, for example, you feel that Nasdaq stocks will crash, then consider getting an inverse ETF that will gain if and when that event occurs.
There are inverse ETFs for stocks, commodities, currencies, and other assets. Keep in mind that inverse ETFs are a form of speculating, so tread carefully here.
Leveraged ETFs are basically designed to double or triple the move of the underlying asset. Say that you’re really, and I mean really, bullish on the S&P 500. In that case, consider a “2x” or “3x” leveraged ETF that will essentially attempt to double or triple the underlying asset’s move.
If you want to find out more about inverse and leveraged ETFs, then check out my book High-Level Investing For Dummies (Wiley).
Other considerations
The preceding categories are the basics, but many investors that use ETF screeners find other criteria for finding appropriate ETFs for their portfolios. Some screeners help you find the best ETFs for income or for tax advantages. Still others have criteria to filter for ETFs that have active management (most ETFs have a passive portfolio) or for total returns year-to-date.
Figure 16-2 shows other considerations that may interest you, depending on your personal situation. For example, a category such as “Tax Form” can help you filter out whether you want an ETF that issues a 1099 or a K-1 if tax considerations are important to you. Other categories are “Commission Free” (a transaction cost consideration) and “Active/Passive,” which are tax considerations.