Postcapitalism: A Guide to Our Future - Paul Mason (2015)
Part I
Chapter 4. The Long, Disrupted Wave
In 1948 the Marshall Plan kicked in, the Cold War began and Bell Laboratories invented the transistor. Each of these events would shape the fourth long cycle that was about to unfold.
The Marshall Plan, a $12 billion US aid package to Europe, ensured the post-war economic boom would take place under American leadership. The Cold War would distort the unfolding wave, first by taking 20 per cent of world production out of the reach of capital and then fuelling a new surge of growth when it ended in 1989. As for the transistor, it would become the core technology of the post-war era, enabling the use of information on an industrial scale.
Those who lived through the post-war boom were amazed, mystified and constantly worried that it would end. Even Harold Macmillan, who told Britons in 1957 that they’d ‘never had it so good’, added: ‘What is beginning to worry some of us is, is it too good to be true?’1 In Germany, Japan and Italy the popular press - quite separately in each country - dubbed the nation’s growth a ‘miracle’.
The numbers were startling. The Marshall Plan, combined with domestic rebuilding efforts, allowed most European economies to grow at well above 10 per cent per year until they reached their pre-war highpoint, which for most was achieved by 1951.2 Regular growth took off spectacularly - and didn’t stop. The US economy more than doubled in size between 1948 and 1973.3 The economies of the UK, West Germany and Italy each grew fourfold in the same period. Japan’s economy, meanwhile, grew tenfold - and this was against a baseline figure close to pre-war normality, not some catch-up effect due to the scale of nuclear destruction. For the entire period, Western Europe’s average annual growth rate was 4.6 per cent - close to double that of the 1900-1913 upswing.4
This was growth driven by productivity on an unprecedented scale. The results are evident in the GDP per-person data. For the sixteen most advanced countries, per-person GDP grew at an average of 3.2 per cent per year between 1950 and 1973. For the entire period between 1870 and 1950 it had averaged 1.3 per cent.5 Real incomes soared: in the USA, the majority of households saw their real incomes rise by more than 90 per cent between 1947 and 1975;6in Japan the average real income increased a staggering 700 per cent.7
Across the developed world, the new techno-economic paradigm was clear - even if each country had its own version. Standardized mass production - with wages high enough to drive consumption of what the factories produced - was unleashed across society. There was male full employment and, subject to cultural variations, increased employment of teenagers and women once the reconstruction phase was over. In the developed world, people moved from the land to the factories in large numbers: between 1950 and 1970 the agricultural workforce in Europe declined from 66 million to 40 million; in the USA it collapsed from 16 per cent of the population to just 4 per cent.8
The most frenetic period of growth in human history was bound to produce glitches. But there were sophisticated economic management techniques to overcome them: realtime statistics, economic planning bodies at a national level, armies of economists and number crunchers in the HQs of the big corporations.
As the boom unfolded, it produced disorientation on the left. Varga - Stalin’s tame economist - actually got it right: in 1946 he warned the Soviet leaders that the state-capitalist methods pioneered during the war could stabilize the West.9 The dominant Anglo-Saxon powers would, he forecast, probably loan the rest of the world enough money to kickstart consumption again, and the wartime methods of state organization would replace the ‘anarchy of capitalist production’.10 For saying this he was hounded from his post, forced to recant and admit to being ‘cosmopolitan’. Stabilization of the Western economies was impossible, Stalin had decreed.
In the West, the far left remained on the doomy side of the argument: ‘The revival of economic activity in capitalist countries weakened by the war … will be characterised by an especially slow tempo which will keep their economies at levels bordering on stagnation and slump,’ wrote the Trotskyists in 1946.11
When this was proved nonsense, Marxists were not the only ones left confused. Even the theorists of moderate social-democracy were so perplexed that they declared the West’s economic system had effectively become non-capitalist. ‘The most characteristic features of capitalism have disappeared,’ wrote Labour MP Anthony Crosland in 1956, ‘the absolute rule of private property, the subjection of all life to market influences, the domination of the profit motive, the neutrality of government, typical laissez-faire division of income and the ideology of individual rights.’12
By the mid-1950s, almost the whole left had embraced the theory of ‘state monopoly capitalism’ - first suggested by Bukharin, then by Varga, and now turned into a full-blown theory by the US left economist Paul Sweezy.13 He believed that state intervention, welfare measures and permanently high military spending had abolished the tendency to crisis. The falling profit rate could be offset by rising productivity - again, permanently. The Soviet Union, it was clear, would have to get used to coexisting with capitalism; the Western labour movement would have to forget revolution and take the upside of the boom, which was considerable.
For the whole period, the focus of debate was on what had changed at the level of the state, the factory, the supermarket, the boardroom and the laboratory. Very little attention was paid to money. However, the crucial factor that underpinned economic reality in the 1950s and 60s was a stable international currency system, and the effective suppression of financial markets.
THE POWER OF EXPLICIT RULES
On 1 July 1944, a special train delivered a cargo of economists, statesmen and bankers to White River Junction, Vermont, from where they were ferried to a hotel in New Hampshire. ‘All trains, regular or scheduled, had to look out for us,’ the train’s fireman remembered, ‘we had the right over everything.’14 Their destination was Bretton Woods. There they would design a global monetary system that, like the train, had ‘the right over everything’.
The Bretton Woods Conference agreed a system of fixed exchange rates designed to restore pre-1914 stability, only this time with explicit rules. All currencies would be pegged against the dollar, and the USA would peg the dollar to gold at $35 an ounce. Countries whose trade balance became seriously out of kilter would have to buy or sell dollars to keep their own currency at the agreed peg.
At the conference, the British economist John Maynard Keynes pushed for the creation of a separate global currency, but the USA rejected the idea. Instead, it secured the dollar’s position as the unofficial global currency. There was no global central bank, but the International Monetary Fund and the World Bank were designed to reduce friction in the system, with the IMF acting as a short-term lender of last resort and enforcer of the rules.
The system was overtly stacked in favour of the USA: not only was it the biggest economy in the world, it had an infrastructure undamaged by the war and - for now - the highest productivity. It also got to appoint the boss of the Fund. The system was also stacked in favour of inflation. Because the link to gold was indirect, because there was leeway in the currency peg, and because the rules on balanced trade and structural reform were loose, the system was designed to produce inflation. This was recognized by the free-market right even before the train to Bretton Woods left the station. The journalist Henry Hazlitt, a confidant of free-market guru Ludwig von Mises, railed against the plan in the New York Times: ‘It would be difficult to think of a more serious threat to world stability and full production than the continual prospect of a uniform world inflation to which the politicians of every country would be so easily tempted.’15
But this was a system also stacked against high finance. Strict limits on bank leverage were imposed by law and ‘moral suasion’ - quiet pressure from central banks on banks that lent too much. In the USA, big banks were required to hold cash or bonds equivalent to 24 per cent of the money they’d lent out.16 In the UK it was 28 per cent. By 1950, bank loans across fourteen advanced capitalist countries equalled just one fifth of GDP - the lowest since 1870, and much smaller than the scale of bank lending during the pre-1914 upswing.
The result created a form of capitalism that was profoundly national. Banks and pension funds were required by law to hold the debt of their own countries; and they were discouraged from making cross-border financial trades. Add to that an explicit ceiling on interest rates and you have what we now call ‘financial repression’.
Here’s how financial repression works: you hold interest rates below inflation, so savers are effectively paying for the privilege of having money; you prevent them moving money out of the country in search of a better deal, and force them to buy the debts of their own country at a premium. The effect, as the economists Reinhart and Sbrancia have shown, was to shrink the combined debts of the developed world dramatically.17
In 1945, because of war spending, the public debts of the developed countries were close to 90 per cent of GDP. But with an inflation spike straight after the war, and then moderate inflation throughout the post-war boom, real interest rates became negative: in the USA between 1945 and 1973, long-term real interest rates were on average minus 1.6 per cent. Because the banking regulations acted as an effective tax on financial assets, economists calculate they raised the equivalent of a fifth of all government income during the boom, even more in the UK.18 The result was to shrink advanced country debts to a historic low of 25 per cent of GDP by 1973.
In short, Bretton Woods achieved something unprecedented: it shrank the debts run up during a global war, suppressed speculation, mobilized savings into productive investment and enabled spectacular growth. It pushed all the latent instability of the system into the sphere of relationships between currencies, but US dominance ensured these were, at first, contained. Right-wing outrage over the inflationary aspect of Bretton Woods was overcome by the greatest period of stability and full production ever known.
Keynes had emphasized, at the design stage the importance of explicit rules - going beyond the gentlemen’s agreement that lay behind the Gold Standard. In the event, explicit rules backed by a global superpower had a multiplier effect few could have imagined.
If the Depression was in part a product of Britain’s decline and America’s refusal to become a global superpower, then it was at Bretton Woods that the USA assumed the duties of a superpower with great passion. In fact, the twenty-five post-war years are the only time in modern history when a great power was truly hegemonic. Britain’s nineteenth-century dominance was always negotiated and relative. Within the capitalist world of the mid-twentieth century, America’s dominance was absolute. This acted like a massive reset button on the world economy, amplifying the upswing. But this was not the only reset button pressed.
THE POST-WAR BOOM AS A CYCLE
A second major change had taken place during wartime, with the state taking control of innovation. By 1945, national bureaucracies had become adept in the use of state ownership and control - and indeed mass communication - to shape private-sector behaviour. Perfectly ordinary managers, under the ultimate pressure of ‘you lose, you die’, had fine-tuned technocracy. Even in the Axis powers, where the state was dismantled in 1945, this culture of innovation and a large part of the technocratic system survived the war.
The case of General Motors is instructive. In 1940, the US government hired GM’s president, Alfred Knudsen, to run its Office of Production Management, which coordinated the whole war economy. He proceeded to place $14 billion-worth of contracts with GM during the war. The corporation converted all of its 200 factories to war production, making - among other things - 38,000 tanks, 206,000 aircraft engines and 119 million shells. It became, in other words, a massive arms company with a single customer. Within this and other giant segments of American industry management effectively operated like a profit-driven state-planning bureau. Nothing like it had been seen before - or since.
At the Federal level, research and development was centralized and industrialized by the Office of Scientific Research and Development. Key to the whole deal was the prohibition of profit directly from research. ‘Profit is a function of the production activities of an industrial establishment, not of a research department,’ the OSRD decreed.19 Contracts were placed where skills were high, where the danger of mass-production overload was least and ‘spread among as many organizations as possible’. Only when all these criteria were equal could the lowest cost be brought into consideration. Competition and patent ownership issues were put on hold.20
These were remarkable things to achieve within capitalism: to treat research as public property, to suppress competition and to plan not just production but the direction of research. And though the USA perfected it, all major combatant states attempted it. The result was to stimulate an unprecedented culture of cross-fertilization in strategic disciplines. The new approach inserted maths and science into the heart of the industrial process; economics and data management into political decision-making.
It was the OSRD that took Claude Shannon, the founder of information theory, out of Princeton and put him into Bell Labs to design algorithms for anti-aircraft guns.21 There, he would meet Alan Turing and discuss the possibility of ‘thinking machines’. Turing, too, had been scooped out of academia by the British government to run the Enigma codebreaking operation at Bletchley Park.
This culture of innovation survived the transition to peacetime, even as individual corporations tried to monopolize the results and scrapped over patent rights. And it was not limited to technical innovation.
In 1942, GM gave management theorist Peter Drucker open access to study its operations. Drucker went on to write The Concept of the Corporation, arguably the first modern management book, which advocated the breakup of command structures and the decentralization of control. Though GM rejected his advice, thousands of other firms did not: the post-war Japanese auto industry adopted them in full. Management theory became a generalized discipline, not secret knowledge, with a whole cohort of consulting firms dedicated to spreading successful techniques rather than hoarding them.
In this sense, the wartime economy gave birth to one of the most fundamental reflexes within the capitalism of the long boom: to solve problems through audacious technological leaps, pulling in experts from across disciplines, spreading the best practice in a sector, and changing the business process as the product itself changed.
The role of the state in all this contrasts with the meagre role of finance. In all normative models of long cycles, it is finance that fuels innovation and helps capital flow into new, more productive areas. But finance had been effectively flattened during the 1930s.
What emerged from the war was a very different capitalism. All it needed was a raft of new technologies - and these were plentiful: the jet engine, the integrated circuit, nuclear energy and synthetic materials. After 1945, the world suddenly smelled of nylon, plastic and vinyl, and buzzed with electrified processes.
But one key technology was invisible: information. Though the ‘information economy’ lay decades in the future, the post-war economies saw information used on an industrial scale. It flowed as science, as management theory, as data, as mass communications and even - in a few hallowed places - out of a computer and into a tray of folding paper.
A transistor is simply a switch with no moving parts. Information theory plus transistors gives you the ability to automate physical processes. So factories throughout the West were re-tooled with semi-automated machinery: pneumatic presses, drills, cutters, lathes, sewing machines and production lines. What they lacked was sophisticated feedback mechanisms: electronic sensors and automated logic systems were so crude that the latter used compressed air to do what we now do with iPhone apps. But human beings were plentiful - and for many manual work became the act of controlling a semi-automated process.
The Cambridge economist Andrew Glyn believed the extraordinary success of the post-war boom could only be explained by ‘a unique economic regime’.22 He described this regime as a mixture of economic, social and geopolitical factors, which operated benignly throughout the upswing until they began to clash and grind in the late 1960s.
State direction produced a culture of science-led innovation. Innovation stimulated high productivity. Productivity allowed high wages, so consumption kept pace with production for twenty-five years. An explicit global rules system amplified the upside. Fractional reserve banking stimulated a ‘benign’ inflation which, combined with financial repression, forced capital into productive sectors and kept speculative finance marginal. The use of fertilizers and mechanization in the developed world boosted land productivity, keeping the cost of inputs cheap. Energy inputs were, at the time, also cheap.
As a result, the period 1948-73 unfolded as a Kondratieff upswing on steroids.
WHAT CAUSED THE WAVE TO BREAK?
There is no dividing line in economic history clearer than 17 October 1973. With their armies at war with Israel, the majority of the oil-exporting Arab countries imposed an oil embargo on the USA and slashed output. The oil price quadrupled. The resulting shock pushed key economies into recession. America’s economy shrank by 6.5 per cent between January 1974 and March 1975,23 Britain’s by 3.4 per cent. Even Japan - which had averaged growth rates close to 10 per cent in the post-war period - went briefly negative.24 The crisis was unique because in the worst-hit countries falling growth coincided with high inflation. By 1975, inflation in Britain reached 20 per cent, and 11 per cent in the USA. The word ‘stagflation’ hit the headlines.
Yet even at the time it was obvious that the oil shock was merely the trigger. The upswing had already been stuttering. In each developed country, growth in the late 1960s seemed beset by national or local problems: inflation, labour troubles, productivity concerns and flurries of financial scandal. But 1973 was the watershed, the point where the energy driving the fourth wave upwards caused it to peak and then invert. What made it happen is a question that has defined modern economics.
For right-wing economists, the answer lay in the exhaustion of Keynesian policy. For the left, however, the explanations have varied over time: in the late 1960s, high wages were seen as responsible; in the following decade, economists of the New Left tried to apply the Marxist overproduction theory.
In fact, 1973 can best be understood as a classic phase change on the Kondratieff pattern. It occurs about twenty-five years into the economic cycle. It is global in scope. It heralds a long period of recurrent crisis. And once we understand what caused the upturn - high productivity, explicit global rules and financial repression - we can understand how it became exhausted.
The post-war arrangements had effectively locked away instability into two zones of control: relations between currencies and relations between classes. Under the Bretton Woods rules, you were not supposed to devalue your currency to make your exports cheap and boost employment. Instead, if your economy was uncompetitive, you could either protect yourself from international competition through trade barriers, or impose ‘internal devaluation’ - cutting wages, controlling prices, reducing the amount spent on welfare payments. In practice, protectionism was discouraged by the Bretton Woods rules and wage cutting was never seriously attempted until the mid-1970s - which left devaluation. In 1949, Britain devalued Sterling by 30 per cent against the dollar and twenty-three other countries followed suit. A total of 400 official devaluations took place before 1973.
So, from the outset, Bretton Woods was a system where states were repeatedly trying to offset their economic failings by manipulating their exchange rates against the dollar. This was seen in Washington as a form of unfair competition, and the USA fought back. By the 1960s, it was devaluing its own currency in real terms, as measured by price differences, against those of its competitors. This subcutaneous economic warfare became overt during the inflation crises of the late 1960s.
Inside the factories, the long boom had been a productivity story and a wages story. In the advanced countries productivity grew at 4.5 per cent per year, while private consumption grew at 4.2 per cent. The rising output of automated machinery more than paid for the rising wages of those operating them. All this was the result of new investment. But the upswing ended once investment could no longer increase productivity at the previous rate.
There are clear signs of a productivity slowdown in the pre-1973 data, and of a fall in the ratio of output to capital invested.25 Productivity, as a counter-tendency to the downward pressure on profits, ran out of steam. But as conditions tightened, the sheer strength of working-class bargaining power in countries with full employment and no will to break the post-war social contract made wage cuts a non-starter. Rather, managers were forced to increase wages and non-wage benefits, while reducing working hours.
As a result, a ‘profit squeeze’ kicked in. Comparing profit rates for America, Europe and Japan in 1973 to their respective peak years during the boom, Andrew Glyn found that in each case they had fallen by one-third. With falling profits, rising wages and alarming levels of shop-floor militancy, there were two pressure valves: to let inflation rip, eroding the value of real wages without having to provoke more disputes; and to go along with social wage rises - easing the pressure on individual businesses by, for example, boosting family allowance and other payments from the state to workers. As a result, social spending by the state - on benefits, subsidies and other income-boosting measures - soared to dysfunctional levels, especially in Europe: from 8 per cent of GDP in the late 1950s to 16 per cent by 1975.26 Over roughly the same period in the USA, Federal spending on welfare, pensions and health doubled to 10 per cent of GDP by the late 1970s.
All it needed to tip this fragile system into crisis was a shock. And in August 1971, Richard Nixon delivered one, unilaterally breaking the commitment to exchange dollars for gold, and thereby destroying Bretton Woods.
Nixon’s reasons for doing so are well documented.27 As America’s competitors caught up in productivity terms, capital flowed out of the US into Europe, while its trade balance declined. By the late 1960s, with every country engaged in expansionary policies - with high state spending and low interest rates - America had become the big loser from Bretton Woods. It needed to pay for the Vietnam War and the welfare reforms of the late 1960s, but could not. It needed to devalue but could not, because to make that happen, other countries had to raise their own currencies against the dollar, and they refused. So Nixon acted.
The world moved from exchange rates fixed against the dollar and gold to totally free-floating currencies. From then on, the global banking system was effectively creating money out of nothing.
With this change, each stricken country was temporarily free to solve the underlying problems of productivity and profitability in ways the old system had made impossible: with higher state spending and lower interest rates. The years 1971-3 were lived in a kind of nervous euphoria.
The inevitable stock market crash hit Wall Street and London in January 1973, triggering the collapse of several investment banks. The oil shock of October 1973 was the final straw.
CARRY ON KEYNES
By 1973, every aspect of the unique regime that had sustained the long boom was broken. But the crisis looked accidental: low input prices destroyed by OPEC; global rules ripped up by Richard Nixon; profits eroded by that figure of loathing, the ‘greedy worker’.
The iconic British Carry On movie franchise chose this moment to switch from ludicrous historical parodies to an attempt at razor-sharp social commentary. Carry On At Your Convenience (1971), set in a toilet factory, satirizes a world in which workers control production, where managers are incompetent, and where sexual freedom is transforming life even on the small-town factory floor. The subtext of Carry On At Your Convenience is that the present system is ludicrous: we can’t go on, but we don’t seem to have an alternative. This, it turned out, was the subtext of the policy response as well.
After 1973, governments tried to fix the system by applying the old, Keynesian rules harder. They used price and wage control policies in an attempt to suppress inflation and appease worker unrest. They used state spending - and borrowing on an increased scale to maintain demand in the face of the slump. But though growth recovered after 1975, it could never reach its old levels.
During the late 1970s, the Keynesian system destroyed itself. This destruction was not just the work of policymakers but of all the players in the Keynesian game: the workers, the bureaucrats, the technocrats, the politicians.
Working-class militancy had already moved out of the factory and into the arena of bargaining nationally with the government. In the mid-1970s, in almost every country the attention of trade union leaders was focused on national wage agreements, price controls, social reform programmes, together with strategies that would maintain their grip over specific sectors - such as the British dockers’ attempt to resist container technology. The ultimate aim of labour movements in the developed world became to put in power leftist social-democratic governments that would permanently guarantee Keynesian policies.
But by this time the business class and key politicians of the right had walked away from the Keynesian world altogether.
THE ATTACK ON LABOUR
It has become commonplace to think that the triumph of globalization and neoliberalism was inevitable. But it was not. Their emergence was just as much the result of government action as corporatism and fascism had been in the 1930s.
Neoliberalism was designed and implemented by visionary politicians: Pinochet in Chile; Thatcher and her ultra-conservative circle in Britain; Reagan and the Cold Warriors who brought him to power. They’d faced massive resistance from organized labour and they’d had enough. In response, these pioneers of neoliberalism drew a conclusion that has shaped our age: that a modern economy cannot coexist with an organized working class. Consequently, they resolved to smash labour’s collective bargaining power, traditions and social cohesion completely.
Unions had come under attack before - but always from paternalist politicians who had proffered the lesser of two evils: in place of militancy, they’d encouraged a ‘good’ workforce, defined by moderate socialism, unions run by agents of the state. And they helped build stable, socially conservative communities that could be the breeding ground for soldiers and servants. The general programme of conservatism, and even fascism, had been to promote a different kind of solidarity that served to reinforce the interests of capital. But it was still solidarity.
The neoliberals sought something different: atomization. Because today’s generation sees only the outcome of neoliberalism, it is easy to miss the fact that this goal - the destruction of labour’s bargaining power - was the essence of the entire project: it was a means to all the other ends. Neoliberalism’s guiding principle is not free markets, nor fiscal discipline, nor sound money, nor privatization and offshoring - not even globalization. All these things were byproducts or weapons of its main endeavour: to remove organized labour from the equation.
Not all the industrialized countries followed the same path, nor at the same pace. Japan had blazed the trail for flexible working in the 1970s by introducing small-team work into production lines, through individual wage bargaining and shouted propaganda sessions in the factory. Of all the advanced economies, Japan was the only one to successfully rationalize industrial business models after 1973. There was of course resistance, dealt with in a brutal fashion - by taking out the ringleaders and beating them physically every day until resistance stopped. ‘It is as though the “company world” were immune from the law of the state,’ wrote the Japanese leftist Muto Ichiyo, who witnessed some of these beatings. ‘And it is natural that in this company world, workers, petrified with horror, their free thinking frozen, keep their mouths shut.’28
Germany, by contrast, resisted labour reforms until the early 2000s, preferring instead to create a peripheral migrant workforce in low-grade service and construction jobs alongside the paternalistic world of the production line. For this it was branded the ‘sick man of the euro’ by The Economist magazine, which as late as 1999 lamented its ‘bloated welfare system and excessive labour costs’.29 These were eradicated in the Harz II labour reforms (2003), which have now left Germany a highly unequal society, with many of its communities gripped by poverty.30
Many developed countries took advantage of the recession of the early 1980s to impose mass unemployment. They adopted policies overtly designed to make the recession deeper: they hiked interest rates, sending old industrial businesses to the wall. They privatized or closed large swathes of coal, steel, auto and heavy engineering production owned by the state. They banned the wildcat and solidarity actions that had plagued managers in the boom years. But they did not, yet, try to dismantle welfare systems; these were needed to maintain social order in communities whose hearts had been ripped out.
The attack on organized labour was punctuated by signal moments. In 1981, the US air traffic control union leaders were arrested, paraded in chains, and the entire workforce sacked for taking strike action. Thatcher used paramilitary policing to destroy the miners’ strike in 1984-5. But the anti-labour offensive’s true success was on a moral and cultural level. From 1980 onward, in the developed world, strikes diminished and so did union density. In the USA, union membership fell from an already low 20 per cent of the workforce in 1980 to 12 per cent by 2003, the survivors heavily clustered in the public sector.31 In Japan it went from 31 per cent to 20 per cent, and in the UK the fall was even more spectacular, from 50 per cent to 30 per cent.32
With the unions sidelined, the transformation of work could begin in earnest, creating the atomized and precarious workforce of today. Those of us who lived through the defeat of organized labour in the 1980s experienced it as traumatic, but told ourselves that our grandfathers had lived through just the same. But if we step back and look at it through the kaleidoscope of long-wave theory, it is in fact unique.
The 1980s saw the first ‘adaptation phase’ in the history of long waves where worker resistance collapsed. In the normal pattern, outlined in chapter 3, resistance forces the capitalists to adapt more radically, creating a new model based on higher productivity and higher real wages. After 1979, the workers’ failure to resist allows key capitalist countries to find a solution to the crisis through lower wages and low-value models of production. This is the fundamental fact, the key to understanding everything that happens next.
The defeat of organized labour did not enable - as the neoliberals thought - a ‘new kind of capitalism’ but rather the extension of the fourth long wave on the basis of stagnant wage growth and atomization. Instead of being forced to innovate their way out of the crisis using technology, as during the late stage of all three previous cycles, the 1 per cent simply imposed penury and atomization on the working class.
Across the Western world the wage share of GDP fell markedly. The economist Engelbert Stockhammer, surveying the damage for the International Labour Organization, showed that this fall in the wage share had been driven entirely by the impact of globalization, financialization and reductions in welfare provision. He wrote: ‘This constitutes a major historical change as wage shares had been stable or increasing in the post-war era.’33
That, as it turns out, is an understatement. It was to trigger the reshaping of the world.
THE DISRUPTED WAVE IN PICTURES
When change is massive and obvious but takes place over decades, two-dimensional charts are sometimes the clearest way to see the big picture. The graphs that follow indicate very clearly what does and does not fit the classic pattern predicted by Kondratieff. They can also give us a clue as to why.
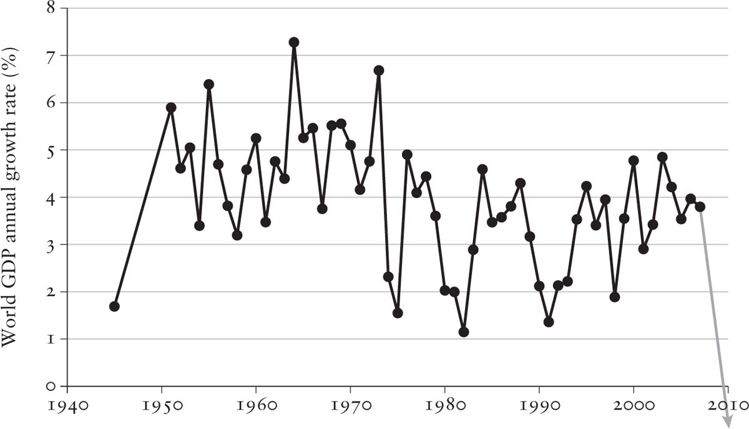
1. World GDP growth
The chart above shows the overall shape of the fourth long wave at a single glance. There’s a clear phase change in the early 1970s. Using the IMF definition of a global recession - when the growth rate dips below 3 per cent - there were no recessions for the first twenty-five years of the wave and six after 1973, the last one a humdinger.34
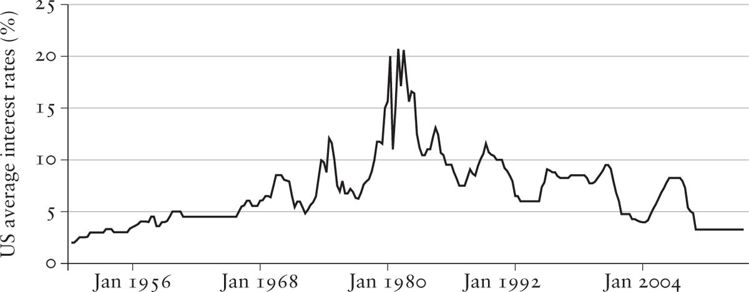
2. Interest rates35
Kondratieff measured his waves using interest rates, and for the post-1945 period there is no clearer metric than this one: the average interest rates banks charge to companies and individuals in the USA. Interest rates rose gradually during the long boom, spiked in the early 1980s - when high interest rates were used to wipe out swathes of the old industries - and have gradually declined, flatlining at the end of the graph because of quantitative easing. Kondratieff’s colleagues, who’d seen this exact pattern in all the previous cycles, would have concluded: ‘Comrade, that’s a long wave.’
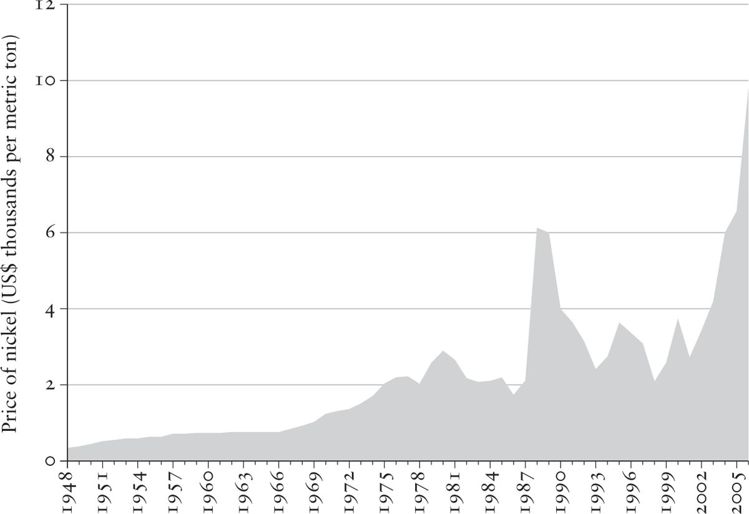
3. Commodity prices: nickel
However, Kondratieff also tracked the prices of basic commodities, such as coal and iron. This graph tracks the price of a modern equivalent, nickel - a key component of stainless steel - over fifty-seven years. I think it would have knocked Kondratieff off his chair. It’s only one commodity but with just a few exceptions, it is fairly representative of what has happened to raw material prices since 1945: there is always a spike to the right of the graph, caused by the rapid development of industry and mass consumption in the global south, above all in China.
A 2007 report by the US Geological Survey shows how, after 1989, all industrial metal prices were driven upwards by China’s entry into the global marketplace.36 China’s nickel usage goes from 30 kt in 1991 to 60 kt in 2001 to 780 kt in 2012. By contrast, over the same period most other major producers’ consumption of nickel and other metals rises fairly slowly, with Germany going from 80 kt to 110 kt.*
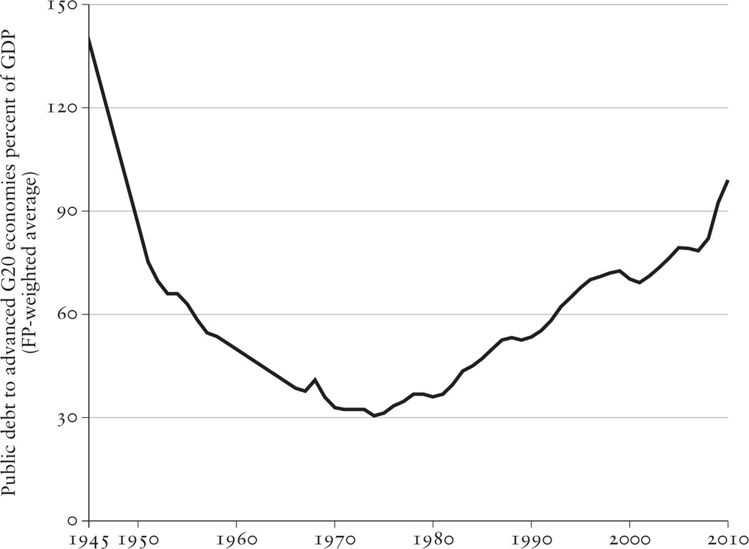
4. Government debt to GDP in twenty advanced economies37
Kondratieff didn’t measure government debt, but in a modern nation it is a good indicator of the economy’s overall health. The chart above shows the debt of states compared to their annual GDP. Financial repression combined with inflation wiped out their war debts over twenty-five years of sustained growth. Then, in the face of crisis from 1973 onwards, the advanced world was forced to raise its debts relentlessly. This debt piles up close to 100 per cent of GDP, despite three decades of welfare cuts and privatization receipts.
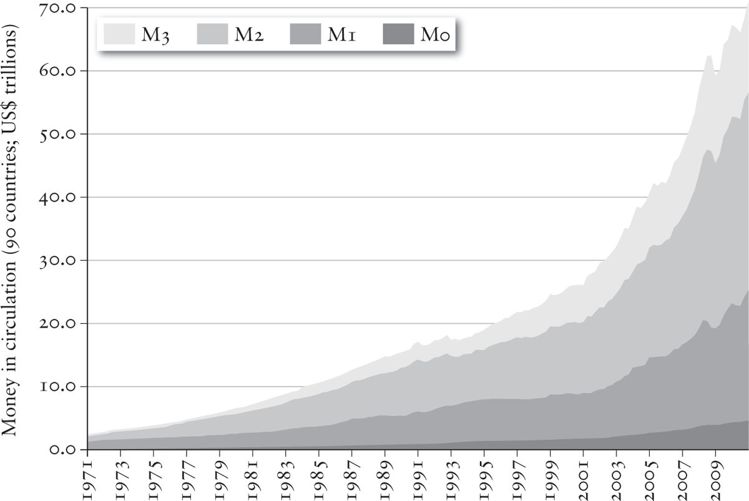
5. Money in circulation
This is Exhibit A in the story of fiat money, money not backed by gold. The graph starts from the moment Nixon abolished Bretton Woods in 1971, and shows the volume of money in circulation in ninety countries, in different forms, ranging from cash, which barely changes, to credit and financial instruments, which grow steadily in the neoliberal era and take off massively after 2000.38
Nixon had detached money and credit from the underlying reality and, although it took decades to create a financial system that could exploit this freedom to the full, from the late 1990s the rate of increase becomes steep.
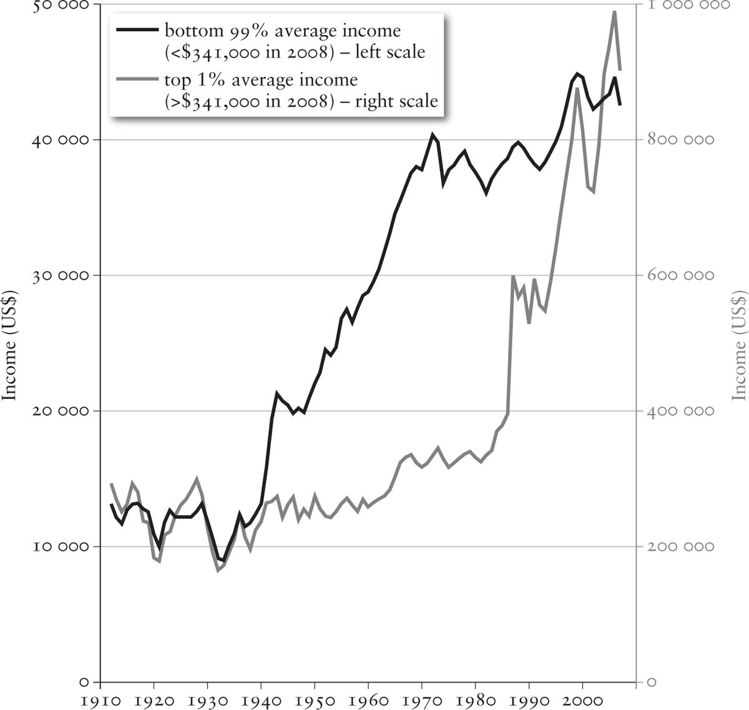
6. Inequality
The dark line shows the real income of the 99 per cent over the fourth long wave. It had already doubled during the Second World War, as people moved from farms to factories, and doubled again between the war and the oil shock. Then it grows very slowly for the whole period after 1989. But for the 1 per cent it is the opposite: the downswing of the cycle is immensely lucrative. Having plateaued during the boom and the crisis years, their incomes (grey line) rocket once free-market economics are unleashed in the late 1980s. There is no more graphic example of who wins and who loses39 within developed countries once the cycle turns downwards.
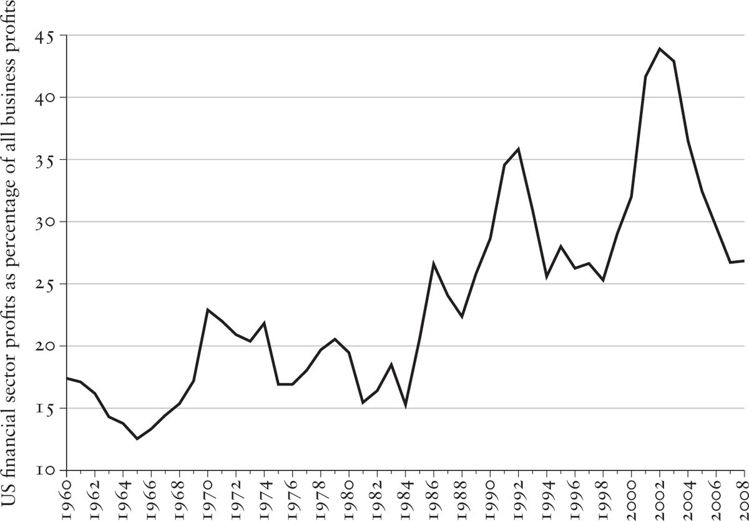
7. Financialization40
This graph shows US finance sector profits as a total of all business profits. During the long boom, financial sector profits in the USA are small. The change picks up pace in the mid-1980s, and in the years before Lehman Brothers collapses we see banks, hedge funds and insurance companies making over 40 per cent of all corporate profit. This is clear evidence for the idea that more of the profits raked in by financialized capitalism are generated by our borrowing and consumption, and less from employing us. On the eve of the crisis, financial profits made up four out of every ten dollars of corporate profit.
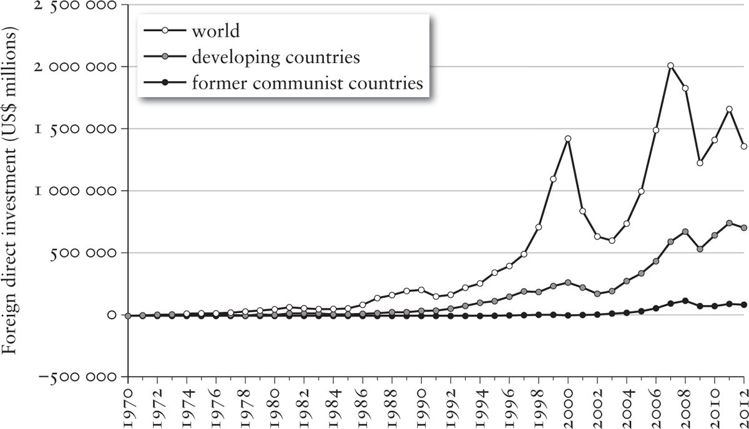
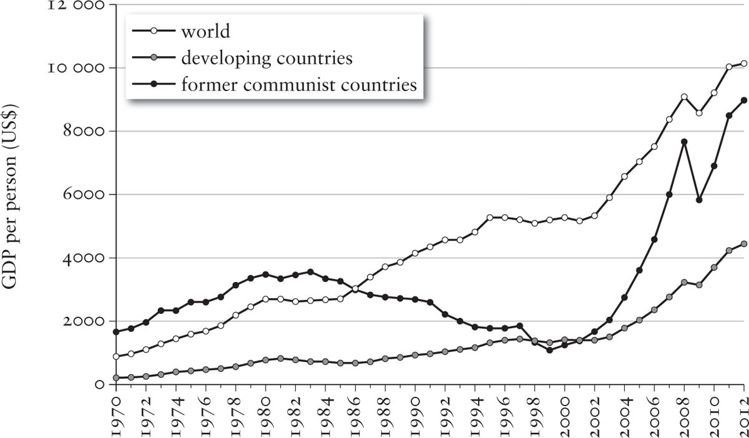
8. Global investment flows
This graph shows in one striking image the reality of globalization. The top line is the total amount of foreign direct investment (FDI) in the world, between 1970 and 2012 (in millions of US dollars at current prices and exchange rates). The middle line shows the amount flowing into developing countries; the bottom line into former communist countries. The gap between the top and middle lines represents the amount of foreign investment flowing between advanced countries.41
Globalization begins the moment the Keynesian paradigm is abandoned. There is a surge of cross-border investments between the advanced countries, mirrored by a steady flow of investment into what we called the ‘Third World’. Capital flows into Russia and its satellites are significant given the size of their economies, but not significant in terms of the bigger picture.
9. GDP per person42
GDP per person is a way of illustrating human progress: how much growth is shared among how many people? The top line shows global GDP per person rising by 162 per cent across the whole world between 1989 and 2012. The former communist countries achieve about the same - albeit via twelve years of catastrophic decline and then a growth surge spurred by Euro entry for the satellites and oil money for Russia itself. But the most spectacular thing is what happens to the bottom line - the developing world. It grows by 404 per cent after 1989.
It is this that prompted the British economist Douglas McWilliams, in his Gresham lectures, to nominate the last twenty-five years as the ‘greatest economic event in human history’. World GDP rose by 33 per cent in the 100 years after the discovery of the Americas, and GDP per person by 5 per cent. In the fifty years after 1820, with the Industrial Revolution underway in Europe and the Americas only, world GDP grew by 60 per cent, and GDP per person by 30 per cent. But between 1989 and 2012 world GDP grew from $20 trillion to $71 trillion - 272 per cent - and, as we’ve seen, GDP per person increased by 162 per cent. On both measures, the period after 1989 outpaces the long post-war boom.43
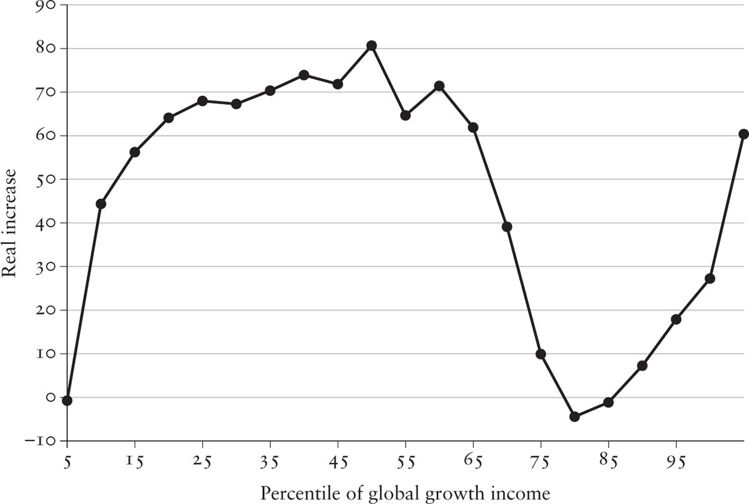
10. Globalization’s winners
During the post-war boom, capitalism suppressed the development of the global south. The means by which it did so are clear and well documented.44 Unequal trade relationships forced much of Latin America, all of Africa and most of Asia to adopt development models that led to super-profits for Western companies and poverty at home. Countries that tried to reject these models, such as Chile or Guyana, had their governments overthrown by CIA coups or, as with Grenada, by invasion. Many found their economies destroyed by debt and by the ‘structural adjustment programmes’ the IMF dictated in return for debt write-offs. With little domestic industry, their growth models relied on the export of raw materials, and the incomes of the poor stagnated.
Globalization changed all that. Between 1988 and 2008 - as the chart shows - the real incomes of two-thirds of the world’s people grew significantly. That’s what the hump on the left-hand side of the graph proves.
Now move to the right-hand side of the graph: the top 1 per cent also see their incomes rise, by 60 per cent. But for everybody in between the super-rich and the developing world - that is for the workers and lower-middle classes of the West - there is a U-shaped hole indicating little or no real increase. That hole tells the story of the majority of people in America, Japan and Europe - they gained almost nothing from capitalism in the past twenty years. In fact, some of them lost out. That dip below zero is likely to include black America, poor white Britain and much of the workforce of southern Europe.
Branko Milanovic, the economist who prepared these figures for the World Bank, called this ‘probably the profoundest global reshuffle of people’s economic positions since the industrial revolution’.45
11. Doubling the world’s workforce
The Harvard economist Richard Freeman calculated that between 1980 and 2000, the world’s workforce doubled in absolute numbers, halving the ratio of capital to labour.46 Population growth and foreign investment boosted the workforce of the developing world, urbanization created a 250-million-strong working class in China, while the former Comecon countries’ workforces were suddenly available to the global market.
The next two graphs show the limits to what can be achieved simply by employing large numbers of low-wage, poor-country workers.
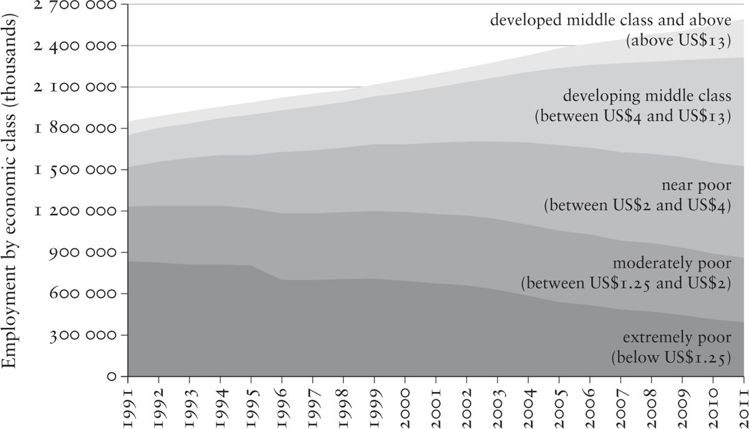
First, above, here’s what has happened to the incomes of the workforce in the developing world since globalization began.
Strikingly, the graph shows the group earning between $4 and $13 a day growing the most rapidly: from 600 million to 1.4 billion.47 (Though the demographers call them the ‘developing middle class’, the $13-a-day mark corresponds roughly to the poverty line in the USA.) These people are mainly workers. They have access to banking and insurance, are likely to own a TV, and usually live in small family groups, not the multigenerational families of the slum, or the solitude of the dormitory. Three-quarters of them work in service industries. The growth of service sector jobs in the developing world reflects both the natural evolution of the job mix under modern capitalism and a second round of offshoring, focused on call centres, IT departments and back-office functions. In short, the graph shows the limits of what offshoring can achieve. That growing wedge of $13-a-day workers is nudging into the income bracket of the poorest American workers.
This means that the days of easy wins for firms offshoring their production are drawing to a close. For the last twenty-five years, large parts of industry in the global south have used ‘extensive’, rather than intensive, methods to boost production. Meaning, if you want to make double the number of trainers, you build an extra factory rather than work on more efficient production methods. But that option is closed down once you have to start paying your most skilled workers the same as a poor person in America. In fact, the impact of rising wages in the developing world is apparent once we look at the second graph, opposite. This stark calculation shows that the initial boost to productivity from the offshoring of hundreds of millions of jobs is over.
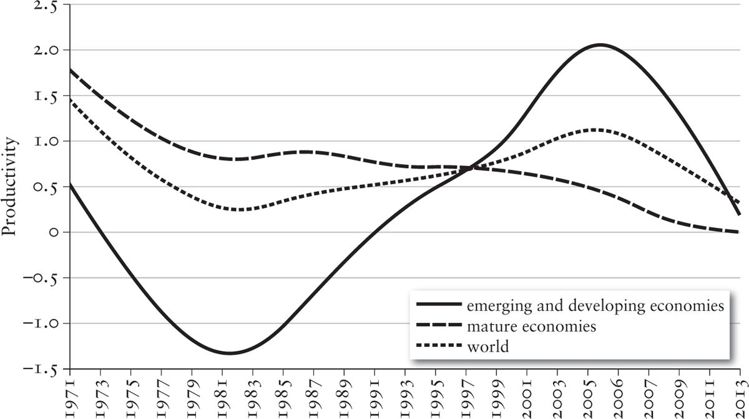
Look at the three lines. Dashed, for the developed world, declines to zero. Its workers are making almost no contribution to productivity in the world. Solid, for the developing world, shows a massive contribution in the first years of globalization, petering out to almost nothing in the last few years. It’s evident from this that much of the productivity boost from globalizing the workforce is over, and that the slowdown in growth in the emerging markets - from China to Brazil - is about to turn into a strategic problem. It is clear from these graphs that the normal wave pattern has been utterly disrupted.
HOW IS THE PATTERN BROKEN?
When the upswing runs out of steam, in the 1960s, it does so for a reason that would not have surprised Kondratieff: the exhaustion of the regime that promoted high productivity alongside wage growth. This led to the famous stop-go crises of the 1960s, when the global system forced governments to rein in growth, and then a breakdown of the global economic order, high inflation and a war in Vietnam so hubristic that the American psyche has still not recovered from the shock of losing it.
Here is the critical difference: in all three previous cycles, workers had resisted the cheap and nasty solution to the crisis - wage cuts, de-skilling and a reduction in the social wage. In the fourth wave, for reasons we will explore in chapter 7, their resistance failed. It was this failure that enabled the entire global economy to be rebalanced in favour of capital.
For about twenty years, this rebalancing worked - and worked so well that it convinced many rational people that a new age had dawned. What the Kondratieff theory had indicated should lead to downturn and depression led instead to two exhilarating decades in which an upswing in profits coexisted with social breakdown, military conflict, the return of abject poverty and criminality to communities in the West - and spectacular riches for the 1 per cent.
But this is not a social order, it is a disorder; it is what you get when you combine the move from production to finance (which Kondratieff would have expected) with a defeated and atomized workforce, and a super-rich elite living off financial profits.
We have listed the factors that allowed neoliberalism to happen: fiat money, financialization, the doubling of the workforce, the global imbalances, including the deflationary effect of cheap labour, plus the cheapening of everything else as a result of information technology. Each seemed like a ‘Get Out of Jail Free’ card, allowing the ordinary karma of economics to be suspended. But as we have seen - and as most of us have experienced in some way - there has been a huge price to pay.
What emerges from this shattered dream? The new technical and economic system will have to be built from the materials to hand. We know it will involve networks, knowledge work, the application of science and a large amount of green technology investment.
The question is: can it be capitalism?