Summary and Analysis of The Euro: How a Common Currency Threatens the Future of Europe - Joseph E. Stiglitz (2016)
Part I. EUROPE IN CRISIS
Chapter 3. EUROPE’S DISMAL PERFORMANCE
It is too soon to tell whether the hopes and dreams of the founders of the euro will eventually be borne out. Today, however, it is plain to see that Europe—or more accurately, the eurozone—has been performing dismally.
Nothing conveys how bad things are in Europe as their impression of when things are going well. The slightest signs of growth or a reduction in unemployment are trumpeted as the harbinger of the long-awaited recovery—only to be followed by disappointment as the economy stagnates. As noted in the preface, it is good that Spain’s unemployment fell from 26 percent in 2013 to 20 percent at the beginning of 2016. But even this “improvement” is partly because so many young Spaniards have left the country, and even with Spain’s alleged growth, GDP per capita is 5.7 percent below its peak in 2007.
The eurozone’s downturn has lasted now for eight years, and it is unlikely that Europe will return to robust growth anytime soon. While already it is clear that Europe is facing a lost decade, there is a risk that in a few years’ time we will be speaking of Europe’s lost quarter-century. Of this we can be sure: Eurozone output will forever be lower than it would have been without the crisis, forever be lower than it would have been had the crisis been better managed. Moreover, growth rates going forward will be lower than they would have been without the crisis, lower than they would have been had the crisis been better managed.
As those, for instance, in Ireland celebrate the return to growth (in 2015 it was Europe’s fastest growing economy),1 they need to remember: every (or almost every) economy recovers from a downturn. The test then of a policy is not whether there was eventually a recovery. As we said earlier, the success of an economic policy is to be judged by how deep and long the downturn before the recovery, how much suffering, and how adverse the impacts on future economic performance. The great success of Keynesian economics was that it led to much shorter downturns (and longer booms) than in the pre-Keynesian era. With downturns nearly a decade long—with GDP in most of the crisis countries slated to be lower in 2017 than a decade earlier—the management of this crisis can hardly be called a success. Some, like Ireland, should commend themselves on doing better than others, such as Portugal and Greece. But, each, in their own way, except when graded against their other failing peers, are an abject failure.
While GDP is the standard measure of economic performance,2 there are other indicators, and in virtually every one, the eurozone’s overall performance is dismal, and that of the crisis countries, disastrous: unemployment is very high; youth unemployment is very, very high; and output per capita is lower than before the crisis for the eurozone as a whole, much lower for some of the crisis countries.
If the decline in GDP per capita or work in the crisis countries were equally shared across the population, that would be one thing. But it is not. Certain individuals can’t find a job as the unemployment rate soars, while others hold on to theirs. Not surprisingly, especially in the crisis countries, inequality has also increased.
The eurozone’s performance on all accounts has been worse than those countries in Europe that do not belong to the eurozone, and worse than in the United States—the country from which the global financial crisis originated and therefore the country which one would have expected to suffer the most.
In this chapter, we lay out a few key statistics that hopefully will make clear how poorly the eurozone has been performing. Indeed, as we noted in chapter 1, even Germany, often held up as the paradigm of success, has been performing poorly.
These data speak for themselves. They show how badly things are going. The fact that the eurozone is doing so much more poorly than countries elsewhere, including countries seemingly similar, suggests that there is common cause for the eurozone’s travails: the euro. Much of the rest of the book attempts to link the eurozone’s poor performance to the euro and the structure of the eurozone itself. The concluding section of this chapter explains succinctly why the eurozone’s poor performance has to be blamed on the euro.
THE EUROZONE AND THE CRISIS
We begin our analysis by describing the economic conditions in the eurozone today, and what has happened since the onset of the crisis.3 We observed in chapter 1 the widely shared fear that the real test of the euro would occur when the eurozone faced a shock—with the shock affecting different countries differently. The rigidities of the euro and the eurozone’s rules, it was thought, would not enable the region to respond. Those fears proved warranted.
STAGNANT GDP
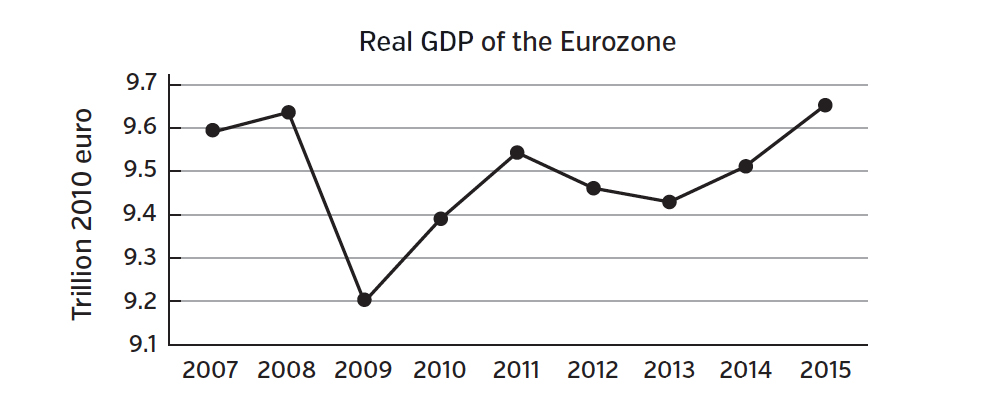
Eurozone GDP adjusted for inflation has been stagnating now for almost a decade. GDP in 2015 was merely 0.6% above that in 2007 (see figure 1).4
FIGURE 1
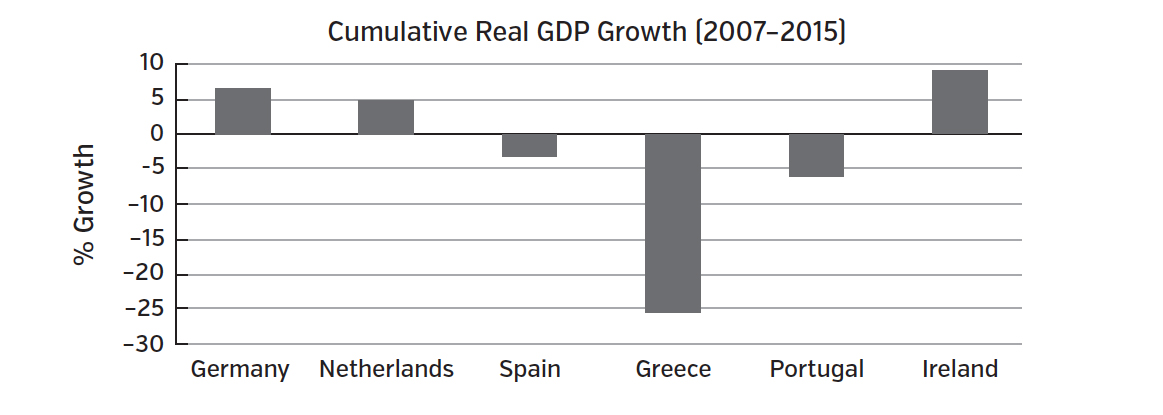
But looking within the eurozone, we see the pattern of divergence anticipated in chapter 1. While on average, eurozone countries have not done well, some have grown modestly, while others, like Greece, have had calamitous declines (see figure 2). Germany, the so-called champion, has grown by 6.8 percent over the eight years since 2007, but at an average annual rate of just 0.8 percent adjusted for inflation, a rate that under normal conditions would have been described as near-stagnation. It only looks good by comparison with its neighbors in the eurozone.
FIGURE 2
Comparison with the Great Depression
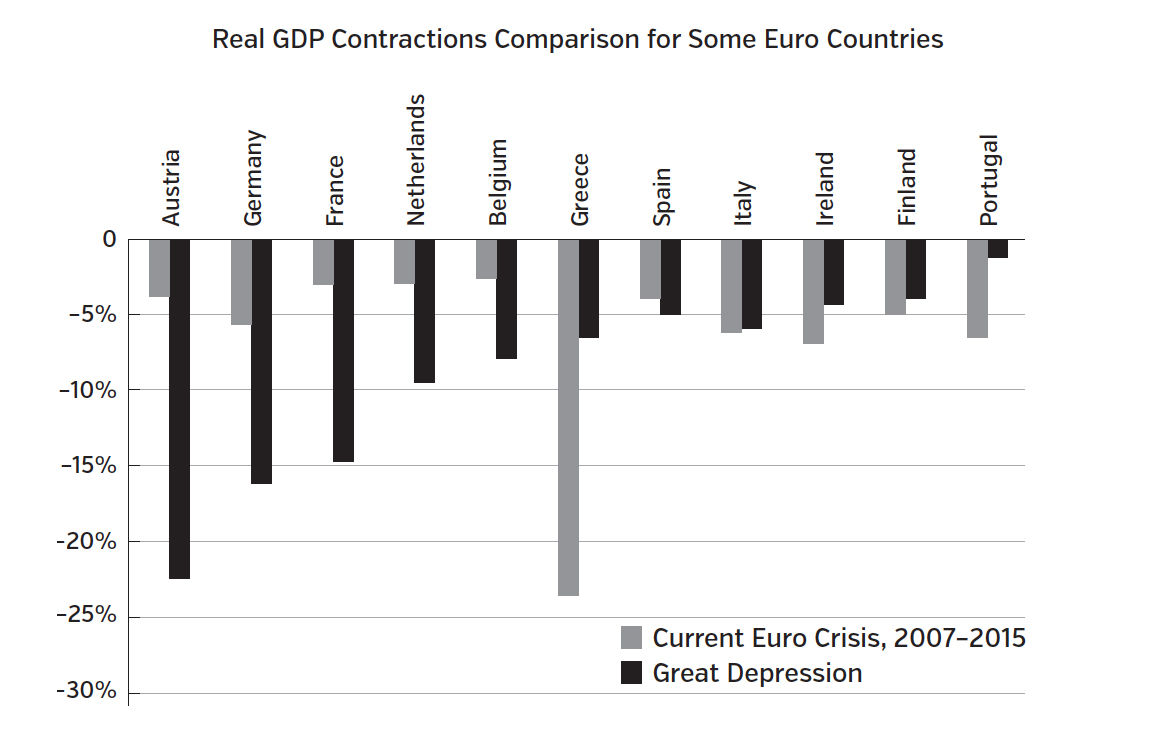
The downturns facing some of the eurozone countries are comparable to or deeper than in the Great Depression. Figure 3 compares the current crisis to the Great Depression for several countries.
FIGURE 35
Comparison with non-eurozone European countries6
The structure and policies of the eurozone have had an especially negative effect in impeding adjustment to shocks—in particular the shock of the global financial crisis. We can see that by comparing growth in the eurozone with non-eurozone Europe (excluding the transition countries of eastern and central Europe). By 2015, non-eurozone Europe had a GDP some 8.1 percent higher than in 2007, in comparison to the 0.6 percent increase within the eurozone.7 And if we consider some of the transition countries of eastern and central Europe that also did not “suffer” from having the euro, there is an even starker difference: no country using the euro came near the success of Poland (28 percent growth) or Romania (12 percent growth).
Comparison with the United States
As we noted earlier, the crisis, of course, began in the United States, yet the United States’ recovery, though anemic, is much stronger than that of the eurozone. From 2007 to 2015, while eurozone output stagnated, US output grew by almost 10 percent.
STANDARDS OF LIVING
A long-accepted mark of economic progress is that living standards should be increasing year after year. Because different countries have populations growing at different rates, standards of living are better captured by looking at GDP per capita than GDP itself. Figure 4 shows per capita GDP between 2007 and 2015 for the United States, the EU, eurozone, and non-eurozone European countries: a more than 3 percent increase for the United States and a 1.8 percent decline for the eurozone.
These numbers, as bad as they are, do not fully capture the magnitude of the declines in the standard of living in the crisis countries, for several reasons. An important element of well-being is economic security, and the crisis countries have been marked by significant increases in insecurity, reflected by astounding increases in unemployment and cutbacks in systems of social protection.
Another important element of well-being is “connectedness,” especially ties with members of one’s family. Here again, there is great suffering in the worst-afflicted countries, as large numbers of young people have had to migrate to London or Berlin or Sydney to obtain jobs. Ireland experienced a nearly 75 percent increase in the number of long-term emigrants from 2007 to 2013. Hundreds of thousands of Greeks have emigrated since the start of the crisis; the number of annual emigrants increased by more than two and a half times from 2008 to 2013.8 Many of these are likely never to return. Partly because of emigration, the total population of Greece has declined.9 Not surprisingly, the emigrants were disproportionately those of working age, including many of Greece’s most talented workers—implying likely lower future growth and a lower ability to repay its debts.10
FIGURE 4
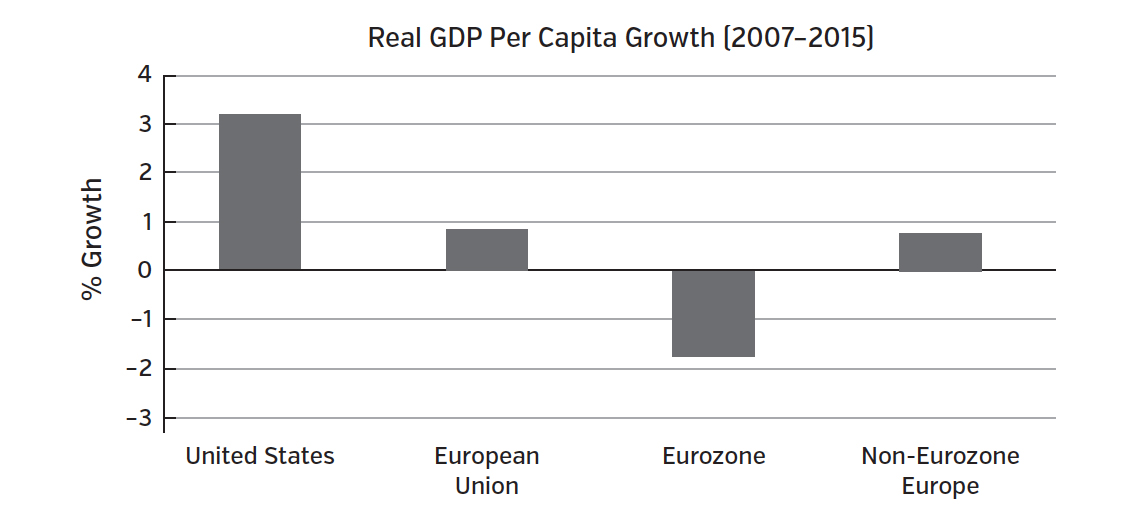
European Union is all EU members in 2007, a total of 27 countries; eurozone refers to the 13 countries using the euro in 2007; non-eurozone Europe refers to Norway, Sweden, Switzerland, and the UK. In each case, growth refers to increase in per capita real GDP, using the countries own price deflator.
Government spending and austerity
In the crisis countries, especially in Greece, there was one more source of erosion in living standards: the Troika forced large decreases in government spending, including in public programs providing education and other basic services. Cutbacks in social programs have heightened insecurity. In Greece, for instance, government expenditure fell by some 22 percent between 2007 and 2015.11 This was especially painful for lower- and middle-income Greeks.
PRODUCTIVITY
As we’ve seen, the EU and the eurozone, by creating a single currency and promoting the free flow of labor and capital, was supposed to create a more productive Europe. So, too, the structural reforms imposed on Greece and Spain and the other crisis countries were supposed to increase productivity.
Because working-age populations (ages 15 to 64) in different countries have grown at different rates—Japan’s working-age population has been shrinking at the rate of around 1 percent a year while the United States’ has been increasing at 0.7 percent a year, and Germany’s has been decreasing at 0.3 percent a year12—it is perhaps more meaningful to compare real (inflation-adjusted) growth per person of working-age GDP than just GDP. One expects Japan’s growth to be lower than that of the United States’, simply because there are fewer workers. If Japan’s growth per working-age population is higher, it tells us something important: it is either finding more jobs for those of working age or it is increasing their productivity.
The eurozone has not been doing well when viewed from this perspective—for the eurozone as a whole, GDP per working-age person has increased by just 0.6 percent during 2007-2015, while for non-eurozone European countries, there has been a 3.9 percent increase.13 The comparison with the United States looks even more unfavorable: while by 2011, US growth in GDP per working-age population had largely returned to precrisis levels, the eurozone area’s number was markedly below—in fact, well below not only that of the United States but of the world and high-income countries.14
In the crisis countries, performance has predictably been even worse. If there has been any increase in productivity, that effect has been overwhelmed by the increase in unemployment. In Greece, output per working-age person has decreased by about 23 percent since 2007. Of course, one of the reasons that Greece has performed so badly is that unemployment is so high. So it’s worth looking at what has happened to output per employed worker. Here, even the best-performing countries of the eurozone do not look very good. While Greece’s productivity (output per employed worker) has declined by 6.5 percent from 2007 to 2015, even Germany has seen a decline (of 0.7 percent), while the United States has had a 7.9 percent increase over the same period.15
UNEMPLOYMENT
Unemployment is important both because it represents a waste of resources—perhaps the most important inefficiency in the market economy, with millions who would like gainful work not being able to obtain it—but also because of the pain it inflicts on those out of work and their families. Unemployment insurance is supposed to help the unemployed, but it is only a partial palliative.
Unemployment is an area where the eurozone performance has been particularly dismal, with average unemployment reaching almost 11 percent in 2015, close to record highs. In the crisis countries, unemployment has been twice that: in Greece, the jobless rate reached a record of 27.8 percent in 2013, and 2015 saw only small reductions from these peaks.16
Youth unemployment
Even more disturbing is the increase in youth unemployment—twice the level of the overall unemployment. The persistence of high unemployment, especially among youth, will have long-lasting effects: these young people will never achieve the incomes that they would have achieved if job prospects were better upon graduation from school.17
Hours worked
In the eurozone, across-the-board average hours worked per worker have declined—implying an even worse performance: fewer people are working, and those who are working are working fewer hours. Even in the so-called star performer, Germany, hours worked per worker fell by almost 4 percent between 2007 and 2014. (It’s worth noting that the allegedly lazy Greeks worked almost 50 percent more hours than the allegedly hard-working Germans in 2014.)18
INEQUALITY
We have focused so far on overall economic performance. But crises are especially hard on those in the middle and bottom of the economic spectrum. They face a high risk of unemployment. Many are at risk of losing their homes. When the unemployment rate increases, wages are cut back, or at least do not increase at the rate they otherwise would. Hours worked are cut back. And as we have noted, those in the middle and bottom are more dependent on public services, and especially in the worst-afflicted countries (but even in those not in crisis) public expenditures have suffered from enormous cutbacks.
We don’t have good data to see how these citizens are faring, but for a few countries, we do have data on what has been happening to inequality. These data suggest that indeed, many are facing hardship. In Spain, for instance, in the years before the crisis, inequality had been coming down, but by 2014, the Gini coefficient, a standard measure of income inequality, was about 9 percent over its 2007 level. In the case of Greece, the Gini coefficient increased by 5 percent from just 2010 to 2014. It usually takes years and years to move the Gini coefficient by a few percentage points.
Data on poverty reinforce the conjecture that those in the middle and bottom have suffered particularly from the crisis. In virtually every country in the eurozone there has been an increase in poverty, especially childhood poverty. By 2012, according to Oxfam, a third of Greeks were below the poverty line and 17.5 percent of the population, more than one million, of those between 18 and 60 lived in households with no income at all.19 From 2008 to 2012, according to a UNICEF measure, the proportion of Greek children in poverty increased from 23 percent to 40.5 percent.20
THE EURO, THE EURO CRISIS, AND LONGER-TERM PERFORMANCE
It is now abundantly clear that Europe’s economy has not been performing well—and has not been performing well at least since the onset of the crisis. But what about its performance before the crisis, and what are the prospects going forward?
To answer that, figure 5 plots the growth of the eurozone for the two decades before the creation of the euro on January 1, 1999, and extrapolates that growth forward (the solid line in the figure). For the period 1999 to 2008, the extrapolation represents an estimate of what would have happened but for the euro. For the period after 2008, the extrapolation represents an estimate of what would have happened but for the euro and the financial crisis. The figure also shows the actual output, the dotted line. Before the euro, there were periods when output was slightly above the trend, others when it was slightly below, but the deviations are relatively small. By comparing the solid line with the dotted line, we can see how the economy performed relative to the simple extrapolation.
There are three striking observations. First, there is not even an overall euro-area growth spurt after the formation of the eurozone. The euro may have helped create bubbles in Spain and Ireland, but it didn’t seem to increase growth for the eurozone as a whole.
Secondly, incomes now are far below the trend that GDP had followed in the years before the euro. By the end of 2015, the gap between that number and the eurozone’s actual GDP was 18 percent—for a loss of some €2.1 trillion ($2.3 trillion dollars at the 2015 average exchange rate of 1.1 dollar per euro). If we add up the gaps year by year, by 2015, the cumulative loss was in excess of €11 trillion, or $12.1 trillion.
FIGURE 521
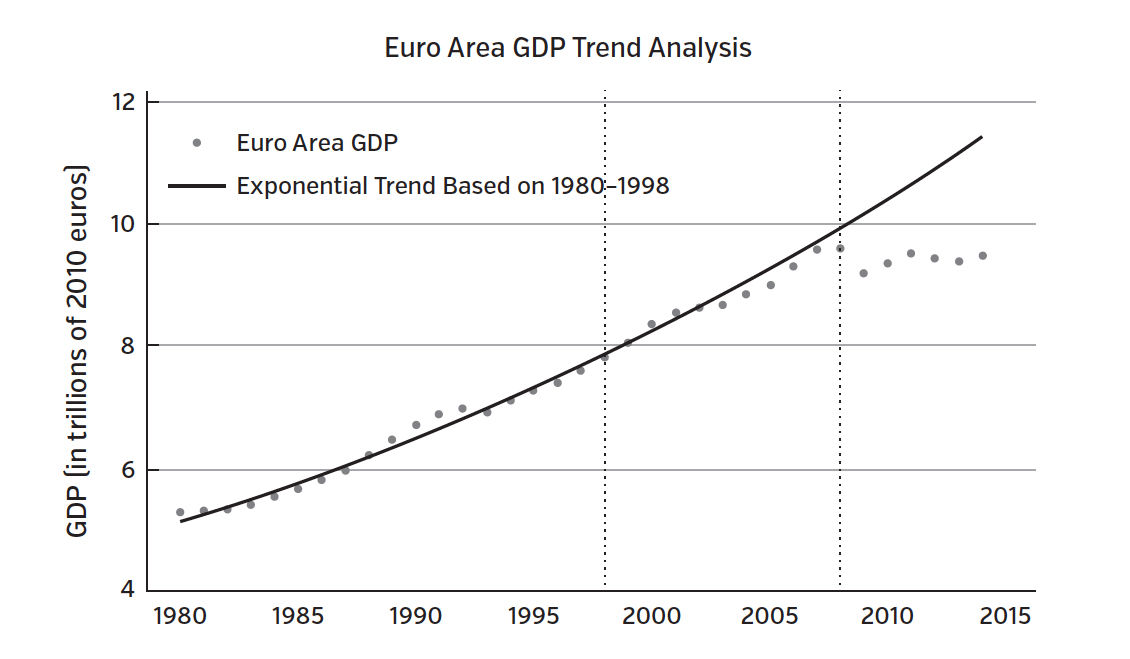
Thirdly, the gap is still increasing—and I believe it will continue to increase so long as the eurozone continues with its current policies. But assume, optimistically, that somehow it managed to return growth to its prior level (unlikely, in the best of scenarios, for the reasons that I have already laid out). Then the total value of the lost output is almost €200 trillion ($220 trillion).22
If one believes that this performance is even partly due to the introduction of the euro, then there is a heavy burden on the currency’s advocates to show that the economic and political benefits exceed these very hefty numbers.
THE EURO AND INDIVIDUAL COUNTRY PERFORMANCE
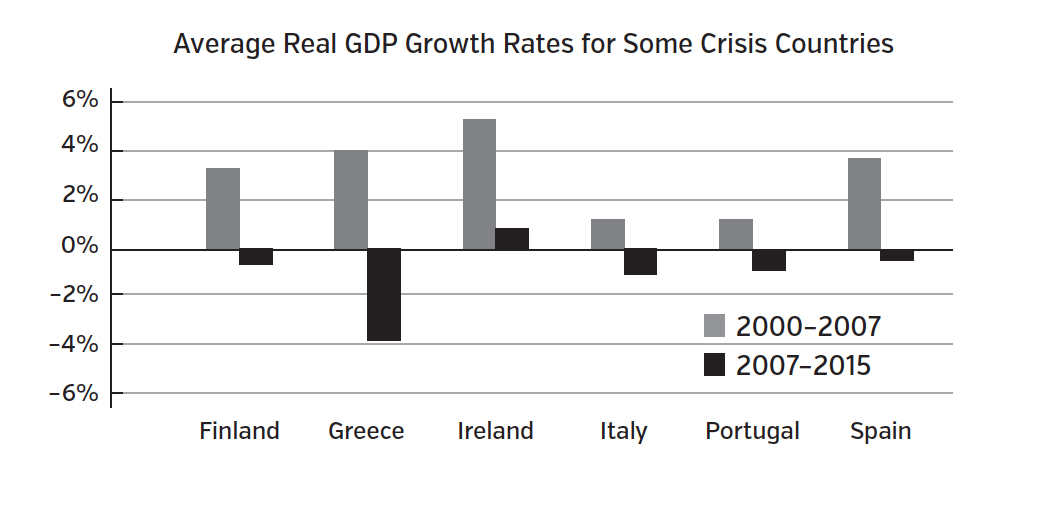
Germany and those who are doing relatively well now blame the crisis on fundamental flaws in the structure of the crisis countries. They have rigid labor markets, are prone to corruption, are nations of tax avoiders and lazy spendthrifts. While one might not be able to do anything about the culture of these countries, at least one can do something about the structure of their economy by weakening their unions, changing their labor and tax laws, and so forth. These “reforms” would enable them to grow once again. The hypothesis of this book is quite different and simple: the euro has impeded their adjustment to the changing circumstances of the world economy, especially the 2008 global financial crisis and the rise of China. Neither their national character nor the institutional and legal frameworks changed in 2008, so if that was what was causing the problem today, one should have seen consistently bad performance, both before 2008 and after. Figure 6 shows the growth rates of Finland and the five crisis countries before (average growth of real GDP, 2000-2007) and after (2007-2015). It shows that each performed remarkably well in the earlier period—in some cases better than the average for the eurozone. It is clear that there is nothing about the structure of these economies that prevents growth. The data are consistent with our hypothesis that there is something that impedes adjustment—the euro. (Finland, as we will explain shortly, though not in a crisis, has been hit by several significant adverse shocks.)
Of course, as we have noted, there are many differences, such as education levels, location, prior investment, etc., that might lead each to have different standards of living. But, as we have already noted, even some of the cultural stereotyping is not supported by the data.
FIGURE 6
FUTURE PROSPECTS
When there is a short and shallow economic downturn, economies often bounce back and make up for the lost time. After the recessions of 1980-1981 in the United States, there was a strong recovery, with growth in excess of 7 percent in 1984. Output in subsequent years was still below what it would have been had there been no recession, but the bounce back was significant.
By contrast, when downturns are long lasting, there is little or no bounce back. The recession eventually comes to an end, but growth after recovery does not make up for what has been lost in the interim. Indeed, there is a high probability that future growth rates will be lower than normal. The human, physical, and intellectual capital of the country is destroyed, or at the very least, does not increase as much as it otherwise would. Not surprisingly, this results in output, output per hour (productivity) and rates of productivity growth being lower than they otherwise would be. Data presented earlier in the chapter are consistent with this: the euro crisis has been deep and long, with deep and persistent consequences.
But there is a further mystery: Because of lower investment during a recession or crisis, we expect productivity (output per worker) to be lower after the recession. But the decline in productivity is greater than we can easily account for. We get less output for any level of inputs, taking account, for instance, of the smaller capital stock.23 We can estimate the predicted effect of the smaller capital and other observable inputs on productivity. The difference between this and the actually observed decline in productivity is the result of missing “dark matter.” Something hard to observe is missing.
Even if we can’t precisely parse out the components of this dark matter, it’s real and needs to be taken into account. There are many components of this missing capital. In their twenties, individuals accumulate skills that increase their productivity over a lifetime. But those skills are gained largely through on-the-job training. When there are no jobs—and youth unemployment in the worse-afflicted countries exceeded 50 percent—there is no on-the-job learning. Indeed, there is even attrition of the skills (including the minimal skills related to being productive members of the labor force).
Microdata confirm these observations: Those who enter the labor force in a bad (recession) year have a significantly lower lifetime income, and this is especially true of those who remain unemployed for extended periods. We also know that those who lose their job in a recession face a significant loss in future income, especially if they face protracted unemployment.
Similarly, firms increase their productivity over time both by learning in the process of production (what is called learning by doing)24 and by spending on research and development. But when economies go into a recession, even a mild one, cutbacks in production mean less learning; and when there is a deep downturn, firms typically face severe budgetary constraints. Firms save where they can, and even though it is bad for the firm’s long-run prospects, R&D expenditures typically are among the areas where there are the greatest cutbacks. And such cutbacks have become even worse as markets have shifted to a greater emphasis on quarterly returns: short-termism has become rampant.25 So, too, firms tend to cut back on other forms of long-term investments. Workers get fired to improve the cash flow of the firm, but this undermines worker loyalty. Bankruptcies increase, and as firms go bankrupt, the organizational and informational capital in firms is destroyed.
There has been a destruction of societal capital, which is not well reflected in our standard metrics, which focus on physical capital, such as machines and equipment. This is seen most dramatically in Greece, the country with the deepest depression. The Troika has forced the tearing up of the social contract, the bonds which existed among members of society. Those who had, for instance, worked hard, on the assumption that they would be paid a modest but livable pension, are now being told that their pension would be cut to levels below subsistence. It is inevitable that such destruction of social capital would have important consequences not just for the functioning of society but for the economy.
This analysis has strong policy implications: there are significant long-term consequences of not taking strong countercyclical policies to ensure a quick restoration of the economy toward full employment. Taking account of these long-term effects implies that the eurozone’s performance since the creation of the euro is even worse—there has been destruction of human and organizational “capital,” and at the minimum, human and knowledge capital has not increased as much as would normally have been the case.
GERMANY
Germany is sometimes held out as a counterexample to the crisis afflicting the rest of the eurozone. Its leaders have seemed to argue that others should follow its examples: if you play by the rules, keeping deficits and debts low, you will prosper.
But Germany only looks successful by comparison to others in the eurozone. If we weren’t grading on the curve—judging on the basis of relative performance—Germany would get a grade of perhaps D-.
As we noted earlier, Germany has grown at an average annual rate of just 0.8 percent from 2007 to 2015 adjusted for inflation, a rate that is about the same as that of Japan during 2001-2010 while it was still in its famous twenty-year malaise. Its performance is especially weak, once account is taken of the rate of growth of its working-age population, which we noted earlier was shrinking at only 0.3 percent a year, compared to a 1 percent decrease a year for Japan.
But, as the International Commission on the Measurement of Economic Performance and Social Progress has emphasized, GDP provides an inadequate measure of overall economic performance. It does not, for instance, take into account the distribution of the benefits of growth: even in Germany, large fractions of the population have seen stagnation or even decreases in their incomes.26 From 1992 to 2010, the income share of the top 1 percent increased by about 24 percent;27 and from the mid-1980s until the mid-2000s, Germany’s Gini coefficient and poverty rates climbed steadily—the latter ultimately exceeding the average for the OECD countries.28 Germany’s success in achieving competitiveness came partly at the expense of those at the bottom, though it does a much better job of protecting those at the bottom than the United States does.29
While Germany is hardly the success that it would like to claim for itself, its modest success does not even provide a template for others. Its growth is based in part on strong trade surpluses, which are not achievable for all countries: A basic identity has it that the sum of trade deficits must equal trade surpluses. If some country has a trade surplus, some other country has to have a trade deficit.
CONCLUDING REMARKS
A single currency was supposed to enhance economic performance for the members of the eurozone. In the years before the crisis, it’s hard to detect any beneficial effect. Critics said the test would come with a crisis: there would then be large losses, as the euro impeded adjustment. This chapter has presented overwhelming evidence that the critics were right. On every criterion by which performance is usually measured, the eurozone has been failing. Its performance has been poor relative to the United States, from which the crisis originated, and relative to non-eurozone Europe. Even Germany could not escape.
COUNTERFACTUALS
Supporters of the euro can’t deny these statistics. They can only give them a different spin. Some might claim that yes, things are bad, but if not for the euro, they would have been even worse. Economists call such thought experiments—analyzing what the world would have been like if it were different in some particular way—counterfactuals.
Here, theory and evidence are totally on the side of the critics of the euro—and much of the rest of this book is devoted to explaining why that is so. The basic idea, though, is simple. If Greece, for instance, had not been tethered to the euro, when the crisis struck, it could have devalued its currency. Tourists, deciding where to take a vacation, would have found Greece so much cheaper and would have flocked to the country. Its income would thus have increased, helping it to recover quickly. Even more, its central bank, realizing the depth of its economic downturn, would have given a further boost to its economy by quickly cutting interest rates—in contrast to the ECB, which even raised interest rates in 2011. At the time of the crisis, Greece suffered from a balance-of-payments problem—importing more than it exported. The adjustments in exchange rates, too, would have done much to correct that, discouraging imports as it encouraged exports and tourism. Even more compelling stories could be told for the other crisis countries.
Supporters of the euro might respond by pointing out that if Greece owed money to, say, Germany in Germany’s currency, the weakening of Greece’s exchange rate would increase the real indebtedness of Greece. True—but that is precisely what is happening now, as Troika policies have lowered Greek incomes by more than a quarter. More relevant, Greece would likely not have borrowed in German currency, precisely because it (and presumably its lenders) should have been aware of the risk that that entailed.30
CORRELATION AND CAUSATION
The poor performance of the eurozone, both absolutely and relative to others, might, of course, be due to some factor other than the euro. And there have been changes in the global economy that have affected the eurozone and, more particularly, one group of countries within the eurozone relative to others. That’s why Germany’s suggestion that the failures of the countries in the eurozone are due to their profligacy seems so out of touch with economic reality, so demonstrative of a total lack of analysis. As we pointed out, only Greece could be tarred with profligacy. Finland has been doing poorly in recent years, with incomes 5 percent below 2007, not because of profligacy but because it has been struck thrice by bad fortune: its leading company, Nokia, has lost ground to other hi-tech companies, like Apple; another leading industry, forestry, has been facing weakening demand; and a major trading partner, Russia, has gone into recession (from low oil prices), and then was hit by Western sanctions. Even Germany’s claim that its success is a result of its own is not so obvious: it had the good fortune for many years of producing goods that were in high demand by China, the engine of global economic growth, while some of the other countries in the eurozone that were not doing so well were producing goods that were competing with Chinese goods.
Later chapters will show clearly the link between the euro and the eurozone’s weak performance; the timing of the eurozone’s weakness is not a coincidence. It is causation, not just correlation. The above analysis has illustrated how the euro impeded adjustment. But the euro also contributed to the crisis itself, as it facilitated trade deficits in Greece, Spain, and other afflicted countries, and these imbalances led to increases in prices in those countries relative to those in Germany. Those imbalances were not sustainable—and were not sustained. But undoing them and dealing with their consequences has proven extraordinarily painful, with costs far greater than the miniscule benefits the countries received in the short period in which they were building up.
THE REAL COSTS OF THE EURO
No economist has a perfect crystal ball. Advocates for the euro might claim that the euro will enable a strong comeback. Such an argument might have been more persuasive a few years ago. As the crisis, recession, and near-recession has dragged on, while elsewhere, more robust recoveries have set in, it appears just the opposite: as we have observed, the eurozone is slated for a lost decade, at best. I have explained why even the rate of growth of GDP is likely to be lower in the future than it has been.
But the cold economic statistics of this chapter do not capture the true failure of the eurozone. Other statistics—a marked increase in suicides31—may give a better sense of the stress ordinary individuals are feeling. Newspaper articles have graphically depicted the social costs of the crisis—pictures of large numbers of citizens picking through garbage and begging, closed stores, social unrest manifested in violent protests. It is the effects of the euro and the eurozone on the lives of the citizens of Europe, including those in the crisis countries, that we should keep in mind as we discuss the sometimes complex issues of monetary arrangements and their effects on economic performance in the following chapters. We need to keep remembering: monetary arrangements are a means to an end, not an end in themselves.