Solar Electricity Handbook 2011: A Simple Practical Guide to Solar Energy - Designing and Installing Photovoltaic Solar Electric Systems - Michael Boxwell (2011)
Calculating Solar Energy
The next two chapters are just as useful for people wishing to install a solar hot water system as they are for people wishing to install solar electricity.
Whenever I refer to solar panel or solar array (multiple solar electric panels) in these two chapters, the information is equally valid for solar electricity and solar hot water.
What is solar energy?
Solar energy is a combination of the hours of sunlight you get at your site and the strength of that sunlight. This varies depending on the time of year and where you live.
This combination of hours and strength of sunlight is called solar insolation or solar irradiance, and the results can be expressed as watts per square metre (W/m²) or, more usefully, in kilowatt-hours per square metre spread over the period of a day (kWh/m²/day). One square metre is equal to 9.9 square feet.
Why is this useful?
Photovoltaic solar panels quote the expected number of watts of power they can generate, based on a solar irradiance of 1,000 watts per square metre. This figure is often shown as a watts-peak (Wp) figure and shows how much power the solar panel can produce in ideal conditions. A solar irradiance of 1,000 watts per square metre is what you could expect to receive at solar noon in the middle of summer at the equator. It is not an average reading that you could expect to achieve on a daily basis.
However, once you know the solar irradiance for your area, quoted as a daily average (i.e. the number of kilowatt-hours per square metre per day), you can multiply this figure by the wattage of the solar panel to give you an idea of the daily amount of energy you can expect your solar panels to provide.
Calculating solar irradiance
Solar irradiance varies significantly from one place to another and changes throughout the year. In order to come up with some reasonable estimates, you need irradiance figures for each month of the year for your specific location.
Thanks to NASA, calculating your own solar irradiance is simple. NASA’s network of weather satellites has been monitoring the solar irradiance across the surface of the earth for many decades. Their figures have taken into account the upper atmospheric conditions, average cloud cover and surface temperature, and are based on sample readings every three hours for the past quarter of a decade. They cover the entire globe.
For reference, I have compiled this information for different regions across the United States, Canada, Australia, New Zealand, the United Kingdom and Ireland in Appendix B.
The website goes further. We have incorporated solar irradiance charts for every major town and city in every country in the world: simply select your location from a pull-down list of countries and cities and you can view the irradiance figures for your exact area.
Using the information in Appendix B, here are the solar irradiance figures for London in the United Kingdom, shown on a month-by-month basis. They show the average daily irradiance, based on mounting the solar array flat on the ground:
|
Jan |
Feb |
Mar |
Apr |
May |
Jun |
Jul |
Aug |
Sep |
Oct |
Nov |
Dec |
|
0.75 |
1.37 |
2.31 |
3.57 |
4.59 |
4.86 |
4.82 |
4.20 |
2.81 |
1.69 |
0.92 |
0.60 |
These figures show how many hours of equivalent midday sun we get over the period of an average day of each month. In the chart above, you can see that in December we get the equivalent of 0.6 of an hour of midday sun (36 minutes), whilst in June we get the equivalent of 4.86 hours of midday sunlight (4 hours and 50 minutes).
Capturing more of the sun’s energy
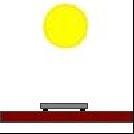
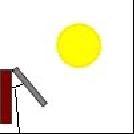
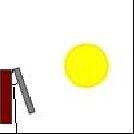
The tilt of a solar panel has an impact on how much sunlight you capture: mount the solar panel flat against a wall or flat on the ground and you will capture less sunlight throughout the day than if you tilt the solar panels to face the sun.
The figures above show the solar irradiance in London, based on the amount of sunlight shining on a single square metre of the ground. If you mount your solar panel at an angle, tilted towards the sun, you can capture more sunlight and therefore generate more power. This is especially true in the winter months, when the sun is low in the sky.
The reason for this is simple: when the sun is high in the sky the intensity of sunlight is high. When the sun is low in the sky the sunlight is spread over a greater surface area:
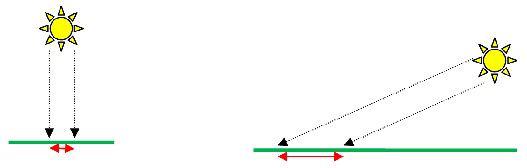
This diagram shows the different intensity of light depending on the angle of sun in the sky. When the sun is directly overhead, a 1m-wide shaft of sunlight will cover a 1m-wide area on the ground. When the sun is low in the sky - in this example, I am using an angle of 30° towards the sun - a 1m-wide shaft of sunlight will cover a 2m-wide area on the ground. This means the intensity of the sunlight is half as much when the sun is at an angle of 30° compared to the intensity of the sunlight when the sun is directly overhead.
The impact of tilting solar panels on solar irradiance
If we tilt our solar panels towards the sun, it means we can capture more of the sun’s energy to convert into electricity. Often the angle of this tilt is determined for you by the angle of an existing roof. However, for every location there are optimal angles at which to mount your solar array, in order to capture as much solar energy as possible.
Using London as an example again, this chart shows the difference in performance of solar panels, based on the angle at which they are mounted. The angles I have shown are flat on the ground, upright against a wall, and mounted at different angles designed to get the optimal amount of solar irradiance at different times of the year (I explain the relevance of these specific angles in a moment):
Flat
|
Jan |
Feb |
Mar |
Apr |
May |
Jun |
Jul |
Aug |
Sep |
Oct |
Nov |
Dec |
|
0.75 |
1.37 |
2.31 |
3.57 |
4.59 |
4.86 |
4.82 |
4.20 |
2.81 |
1.69 |
0.92 |
0.60 |

Upright
|
Jan |
Feb |
Mar |
Apr |
May |
Jun |
Jul |
Aug |
Sep |
Oct |
Nov |
Dec |
|
1.20 |
1.80 |
2.18 |
2.58 |
2.70 |
2.62 |
2.71 |
2.80 |
2.47 |
2.07 |
1.43 |
1.01 |
38° angle - Best year-round tilt
|
Jan |
Feb |
Mar |
Apr |
May |
Jun |
Jul |
Aug |
Sep |
Oct |
Nov |
Dec |
|
1.27 |
2.04 |
2.76 |
3.67 |
4.17 |
4.20 |
4.25 |
4.16 |
3.26 |
2.41 |
1.53 |
1.05 |
23° angle - Best winter tilt
|
Jan |
Feb |
Mar |
Apr |
May |
Jun |
Jul |
Aug |
Sep |
Oct |
Nov |
Dec |
|
1.30 |
2.03 |
2.62 |
3.34 |
3.66 |
3.69 |
3.76 |
3.73 |
3.06 |
2.37 |
1.56 |
1.08 |

53° angle - Best summer tilt
|
Jan |
Feb |
Mar |
Apr |
May |
Jun |
Jul |
Aug |
Sep |
Oct |
Nov |
Dec |
|
1.19 |
1.95 |
2.77 |
3.84 |
4.52 |
4.63 |
4.66 |
4.41 |
3.31 |
2.33 |
1.43 |
0.97 |

Adjusting the tilt manually each month
|
Jan |
Feb |
Mar |
Apr |
May |
Jun |
Jul |
Aug |
Sep |
Oct |
Nov |
Dec |
|
1.30 22° tilt |
2.05 30° tilt |
2.78 38° tilt |
3.86 46° tilt |
4.70 54° tilt |
4.91 62° tilt |
4.90 54° tilt |
4.46 46° tilt |
3.31 38° tilt |
2.41 30° tilt |
1.56 22° tilt |
1.08 14° tilt |
Note: All angles are given in degrees from vertical and are location specific.
Look at the difference in the performance based on the tilt of the solar panel. In particular, look at the difference in performance in the depths of winter and in the height of summer.
It is easy to see that some angles provide better performance in winter; others provide better performance in summer, whilst others provide a good compromise all-year-round solution.
Calculating the optimum tilt for solar panels
Because of the 23½° tilt of the earth relative to the sun, the optimum tilt of your solar panels will vary throughout the year, depending on the season. In some installations, it is feasible to adjust the tilt of the solar panels each month, whilst in others it is necessary to have the array fixed in position.
To calculate the optimum tilt of your solar panels, you can use the following sum:
90° - your latitude = optimum fixed year-round setting
This angle is the optimum tilt for fixed solar panels for all-year-round power generation. This does not mean that you will get the maximum power output every single month: it means that across the whole year, this tilt will give you the best compromise, generating electricity all the year round.
Getting the best from solar panels at different times of the year
Depending on when you want to use your solar energy, you may choose to use a different tilt in order to improve power output at a given point in the year. Each month of the year, the angle of the sun in the sky changes by 7.8° - higher in the summer and lower in the winter. By adjusting the tilt of your solar panel to track the sun, you can tweak the performance of your system according to your requirements.
You may want to do this for a number of reasons:
· For a stand alone, off-grid system, you often need to get as much power generation during the winter months as possible to counter the reduction in natural light
· When installing a grid-tie system in a cool climate, where the focus is on reducing your carbon footprint, you can choose to boost your electricity production in winter, to offset the amount of electricity you need to buy when demand is at its highest
· When installing a grid-tie system where the focus is on making the most profit by selling your power, you can choose to tilt your solar panels at a summer setting and thereby produce the maximum amount of energy possible over the course of the year
You can see this monthly optimum angle (rounded to the nearest whole degree) on the bottom row of the previous table.
Optimum winter settings
Here is an example of how you could tweak your system. Performance of a solar system is at its worst during the winter months. However, by tilting your panels to capture as much of the sunlight as possible during the winter, you can significantly boost the amount of power you generate at this time.
Based on the Northern Hemisphere, an optimum winter tilt for solar panels is the optimum angle for November and January. For the Southern Hemisphere, the optimum winter tilt is May and July:
90° - your latitude - 15.6° = optimum winter setting
As you can see from the previous table, if you tilt your solar panels at this angle, you will sacrifice some of your power generation capability during the summer months. However, as you are generating so much more power during the summer than you are in the winter, this may not be an issue.
More importantly, compared to leaving the panels on a flat surface, you are almost doubling the amount of power you can generate during the three bleakest months of the year. This means you can reduce the number of solar panels you need to install.
Optimum summer settings
If you wish to get the best output of your system overall, you will find that you will get slightly more energy, when measured over the course of the whole year, by angling your solar panels to an optimum summer time tilt.
In warm climates, where maximum energy consumption is during hot weather, angling your panels to get the maximum amount of sunlight during the height of summer can be the best solution, both financially and environmentally.
For Northern Hemisphere countries, the optimum summer time tilt is the optimum angle for May and July. For Southern Hemisphere countries, the optimum summer time tilt is the optimum angle for November and January:
90° - your latitude + 15.6° = optimum summer setting
Positioning your solar panels
Regardless of where you live, the sun always rises from the east and sets in the west. If you live in the Northern Hemisphere, solar panels will always work best if they are south-facing. In the Southern Hemisphere, solar panels work best if they are north-facing.
However, it is not always possible to position your solar panels so they are facing exactly the right way. For instance, if you want to install solar panels on the roof of the house, and the roof faces east/west, then it may not be practical to install solar panels in any other location.
Thanks to improved solar panel design over the past decade, this is not as big a problem as was once the case. Whilst the figure varies slightly in different parts of the world, from one solar panel manufacturer to another and during the different seasons of the year, the average efficiency drop of a solar panel mounted away from due south (due north in the Southern Hemisphere) is around 1.1% for every five degrees.
This means that if your panels face due east or due west, you can expect around 20% loss of efficiency compared to facing your panels in the optimum position.
You can even face your panels in the completely opposite direction - north in the Northern Hemisphere or south in the Southern Hemisphere - losing around 40% of the efficiency of your solar array by doing so.
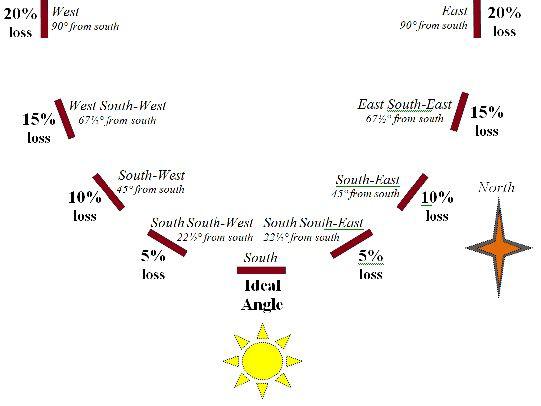
For the Northern Hemisphere, this chart shows the approximate efficiency loss by not facing your panels directly south. For Southern Hemisphere countries, the chart should be reversed.
Using solar irradiance to work out how much energy a solar panel will generate
Based on these figures, we can calculate on a monthly basis how much power a solar panel will give us per day, by multiplying the monthly solar irradiance figure by the stated wattage of the panel:
Solar Irradiance x Panel Wattage = Watt-hours per day
As we now know, the solar irradiance figure depends on the month and the angle for the solar panel. Assuming we have a 20-watt solar panel, mounted flat on the ground, here are the calculations for London in December and June:
Flat
|
December |
June |
|
0.60 x 20W = 12 Wh of energy per day |
4.86 x 20W = 97 Wh of energy per day |
As you can see, there is a big difference in the amount of energy you can generate in the middle of summer, compared to winter. In the example above, over eight times the amount of energy is generated in the height of summer compared to the depths of winter.
Here are the same calculations again, but with the solar panels angled at 38° for best all-year-round performance. Note the significant improvement in winter performance and the slightly reduced summer performance:
38° angle
|
December |
June |
|
1.05 x 20W = 21 Wh of energy per day |
4.20 x 20W = 84 Wh of energy per day |
Using solar irradiance to give you an approximate guide for the required power capacity of your solar array
In the same way that you can work out how much energy a solar panel will generate per day, you can use solar irradiance to give you an approximate guide for the required capacity of solar array that you need.
I say an approximate guide, because the actual capacity will also need to take into account:
· The peculiarities of your site
· The location and angles of your solar panels
· Any obstacles blocking the sunlight at different times of year
I cover all this in the next chapter when I look at the site survey.
Nevertheless, it can be useful to carry out this calculation in order to establish a ballpark cost for your solar electric system. The calculation is simple: take the figure you calculated for your total number of watt-hours per day and divide it by the solar irradiance figure for the worst month that you require your system to work.
Using our holiday home as an example, we can look at our watt-hours per day figure of 695Wh/day and then divide this number by the worst month on our irradiance chart (December). It is worth doing this based on mounting the solar panel at different angles, to see how the performances compare:
|
Flat |
695 ÷ 0.6 = 1159 watts |
If we have our solar panels laid flat, we would need a 1,159-watt solar array to power our home in December. |
|
Upright |
695 ÷ 1.01 = 688 watts |
If we mount the solar panels vertically against a wall, we could generate the same amount of power with a 688-watt solar array. |
|
38° angle Best year-round tilt |
695 ÷ 1.05 = 661 watts |
Angled towards the equator, we could generate the same amount of power with a 661-watt solar array. |
|
23° angle Best winter tilt |
695 ÷ 1.08 = 643 watts |
With the optimum winter tilt, we can use a 643-watt solar array. |
|
53° angle Best summer tilt |
695 ÷ 0.97 = 716 watts |
Angled towards the summer sun, we would require a 716-watt solar array to provide power in December |
|
Tilt adjusted each month |
695 ÷ 1.08 = 643 watts |
With the tilt of the solar panel adjusted each month, we can use a 643-watt solar array, the same as the best winter tilt settings. |
This chart tells us that to provide full power for our holiday home in December, we require a solar array with a generation capacity of between 643 watts and 1159 watts, depending on the tilt of the solar panels.
But remember our scope. We only want to use the home full time from March to October. The solar electric system only needs to provide enough electricity for a long weekend during the winter.
This means that, so long as our batteries are big enough to provide electrical power for a few days, it does not matter if the solar power in winter is not enough to provide for constant use. As soon as we close up the holiday home again, the solar panels will recharge the batteries.
Here are my calculations again, this time using October as our worst month:
|
Flat |
695 ÷ 1.69 = 411 watts |
If we have our solar panels laid flat, we would need a 411-watt solar array to power our home in October. |
|
Upright |
695 ÷ 2.07 = 335 watts |
If we mount the solar panels vertically against a wall, we could generate the same amount of power with a 335-watt solar array. |
|
38° angle Best year-round tilt |
695 ÷ 2.41 = 288 watts |
Angled towards the equator, we could generate the same amount of power with a 288-watt solar array. |
|
23° angle Best winter tilt |
695 ÷ 2.37 = 293 watts |
With the optimum winter tilt, we can use a 293-watt solar array. |
|
53° angle Best summer tilt |
695 ÷ 2.33 = 298 watts |
Angled towards the summer sun, we would require a 298-watt solar array to provide power in October |
|
Tilt adjusted each month |
695 ÷ 2.41 = 288 watts |
With the tilt of the solar panel adjusted each month, we can use a 288-watt solar array, the same as the best year-round tilt settings. |
This chart tells us that we require a solar array with a generation capacity of between 288 watts and 411 watts, depending on the tilt of the solar panels. Compared to our earlier calculations for generating power throughout the year, it is much lower. We have just saved ourselves a significant amount of money.
You can also see that during the summer months, the solar electric system will generate considerably more electricity than we will need to run our holiday home. That is fine. Too much is better than not enough and it allows for the occasions when a light is left switched on or a TV is left on standby.
Solar panels and shade
The biggest negative impact on solar energy production is shade. Even if only a very small amount of your solar array is in shade, the impact on the performance of your whole system can have a very big effect.
Unlike solar thermal (hot water) systems, the loss of power through shading is much greater than the amount of the panel that is in shade. With solar thermal systems, if 5% of the panel is in shade, you lose around 5% of the power production.
Depending on the exact circumstances, even if only 5% of a photovoltaic solar panel is in shade, it is possible to lose 50-80% of power production from your entire solar array.
For this reason, it is hugely important that your solar energy system remains out of shade throughout the day. Sometimes this is not possible, and this requires some additional design work in order to keep the effect of shade on your system to a minimum.
I cover shade in much more detail in Appendix A, including an explanation of why shade has such a big impact on energy production. For now, it is just important to know that shading can significantly affect the amount of energy you can get from your solar energy system.
Solar array power point efficiencies
Now we know the theoretical size of our solar panels. However, we have not taken into account the efficiencies of the panels themselves or the efficiencies of the controller or inverter that handles them.
Solar panels are rated on their ‘peak power output’. Peak power on a solar panel in bright sunlight is normally generated at between 14 and 20 volts. This voltage can go up and down quite significantly, depending on the amount of sunlight available.
This swing in voltage gets much higher if you have multiple solar panels connected together in series - or if you are using a higher-voltage solar panel. It is common for a solar array with fifteen or twenty panels connected in series to have voltage swings of several hundred volts when a cloud obscures the sun for a few seconds!
Managing this voltage swing can be done in one of two ways. The cheap and simple method is to cut the voltage down to a setting that the solar panel can easily maintain. For instance, a solar panel rated at 12 volts will usually maintain a voltage level of at least 14 volts during daylight hours. A charge controller or inverter that cuts the voltage down to this level will then always be able to use this power. The disadvantage of this approach is that, as you cut the voltage, the wattage drops with it, meaning you can lose a significant amount of energy.
In terms of the amount of energy you can capture, as opposed to what the solar array collects, this method can reduce the efficiency of a solar array by around 25%.
A better solution is to use controllers and inverters that incorporate Maximum Power Point Tracking (MPPT). Maximum power point tracking adjusts the voltage from the solar array to provide the correct voltage for the batteries or for the inverter in order to remove this inefficiency.
Maximum power point trackers are typically 90-95% efficient. Over the past three years, the price of MPPT controllers and inverters has dropped and the availability has increased to the point where it is almost always worth buying an MPPT controller and inverter for all but the very smallest and simplest solar installations.
Incidentally, you only need an MPPT inverter for grid-tie systems where you are powering the inverter directly from the solar panels. You do not require an MPPT inverter if you are planning to run the inverter through a battery bank.
To take into account power point efficiencies, you need to divide your calculation by 0.9 if you plan to use a MPPT controller or inverter, and by 0.75 if you plan to use a non-MPPT controller or inverter:
|
Non MPPT controller/inverter calculation |
MPPT controller/inverter calculations |
||
|
Flat solar panel |
Solar panel at 38° tilt |
Flat solar panel |
Solar panel at 38° tilt |
|
411 watts ÷ 0.75 = 548 watt solar panel |
288 watts ÷ 0.75 = 384 watt solar panel |
411 watts ÷ 0.9 = |
288 watts ÷ 0.9 = |
The effects of temperature on solar panels
Solar panels will generate less power when exposed to high temperatures compared to when they are in a cooler climate. Solar PV systems can often generate more electricity on a day with a cool wind and a hazy sun than when the sun is blazing and the temperature is high.
When solar panels are given a wattage rating, they are tested at 25°C (77°F) against a 1,000 W/m² light source. At a cooler temperature, the solar panel will generate more electricity, whilst at a warmer temperature the same solar panel will generate less.
As solar panels are exposed to the sun, they heat up, mainly due to the infrared radiation they are absorbing. As solar panels are dark, they can heat up quite considerably. In a hot climate, a solar panel can quite easily heat up to 80-90°C (160-175°F).
Solar panel manufacturers provide information to show the effects of temperature on their panels. Called a temperature coefficient of power rating, it is shown as a percentage of total power reduction per 1°C increase in temperature.
Typically, this figure will be in the region of 0.5%, which means that for every 1°C increase in temperature, you will lose 0.5% efficiency from your solar array, whilst for every 1°C decrease in temperature you will improve the efficiency of your solar array by 0.5%.
Assuming a temperature coefficient of power rating of 0.5%, this is the impact on performance for a 100W solar panel at different temperatures:
|
5°c / 41°F |
15°c / 59°F |
25°c / 77°F |
35°c / 95°F |
45°c / 113°F |
55°c / 131°F |
65°c / 149°F |
75°c / 167°F |
85°c / 185°F |
|
|
Panel output for a 100W solar panel |
110W |
105W |
100W |
95W |
90W |
85W |
80W |
75W |
70W |
|
Percentage gain/loss |
10% |
5% |
0% |
-5% |
-10% |
-15% |
-20% |
-25% |
-30% |
In northern Europe and Canada, high temperature is not a significant factor when designing a solar system. However, in southern states of America and in Africa, India, Australia and the Middle East, where temperatures are significantly above 25°C (77°F) for much of the year, the temperature of the solar panels may be an important factor when planning your system.
If you are designing a system for all-year-round use, then in all fairness a slight dip in performance at the height of summer is probably not an issue for you. If that is the case, you do not need to consider temperature within the design of your system and you can skip this information.
If your ambient temperature is high during the times of year you need to get maximum performance from your solar panels, then you will need to account for temperature in your design.
You can help reduce the temperature of your solar panels by ensuring a free flow of air both above and below the panels. If you are planning to mount your solar panels on a roof, make sure there is a gap of around 7-10cm (3-4") below the panels, to allow a flow of air around them. Alternatively, you can consider mounting the panels on a pole, which will also aid cooling.
For a roof-top installation, if the average air temperature at a particular time of year is 25°C/77°F or above, multiply this temperature in Celsius by 1.4 in order to get a likely solar panel temperature. For a pole-mounted installation, multiply your air temperature by 1.2 in order to calculate the likely solar panel temperature. Then increase your wattage requirements by the percentage loss shown in the temperature coefficient of power rating shown on your solar panels, in order to work out the wattage you need your solar panels to generate.
Temperature impact on solar performance in Austin, Texas during the summer months
By way of an example, here is a table for Austin in Texas. This shows average air temperatures for each month of the year, the estimated solar panel temperature for the hottest months of the year and the impact on the performance on the solar array, assuming a temperature coefficient of power rating of 0.5%.
|
Jan |
Feb |
Mar |
Apr |
May |
Jun |
Jul |
Aug |
Sep |
Oct |
Nov |
Dec |
|
|
Average monthly temperature |
49°F 10°C |
53°F 12°C |
62°F 16°C |
70°F 21°C |
76°F 24°C |
81°F 27°C |
85°F 29°C |
85°F 29°C |
81°F 27°C |
71°F 22°C |
61°F 16°C |
52°F 11°C |
|
Likely roof-mounted temperature of solar array (Celsius x 1.4) |
93°F 34°C |
100°F 38°C |
106°F 41°C |
106°F 41°C |
100°F 34°C |
|||||||
|
Performance impact for roof -mounted solar: |
-4½% |
-6½% |
-8% |
-8% |
-6½% |
|||||||
|
Likely pole-mounted temperature of solar array (Celsius x 1.2) |
84°F 29°C |
90°F 32°C |
95°F 35°C |
95°F 35°C |
90°F 32°C |
|||||||
|
Performance impact for pole- mounted solar: |
-2% |
-3½% |
-5% |
-5% |
-3½% |
The Performance Impact calculations in rows 3 and 5 of the above table are calculated using the following formula:
(Estimated Solar Panel Temp °C - 25°C) x (-Temp Coefficient of Power Rating)
So, for July, the calculation for roof-mounted solar was (41°C - 25°C) x (-0.5) = -8%
For around five months of the year, the ambient temperature in Austin is greater than 25°C/77°F. During these months, the higher temperature will mean lower power output from a solar array. If you are designing a system that must operate at maximum efficiency during the height of summer, you will need to increase the size of your solar array by the percentages shown, in order to handle this performance decrease.
You can find the average ambient air temperature for your location by visiting The Weather Channel website at www.weather.com. This excellent site provides average monthly temperatures for towns and cities across the world, shown in your choice of Fahrenheit or Celsius.
Our example holiday home project is in the United Kingdom, where the temperature is below 25°C for most of the year. In addition, our solar design will produce more power than we need during the summer months. As a result, we can ignore temperature in our particular project.
Working out an approximate cost
It is worth stressing again that these figures are only approximate at this stage. We have not yet taken into account the site itself and we are assuming that shading will not be an issue.
If you are planning to do the physical installation yourself, a solar electric system consisting of solar array, controller and battery costs around £4.00 ($6.20 US) per watt, +/- 15%.
A grid-tie system is cheaper to install than a stand-alone system, as you do not need to budget for batteries. You will, however, need a qualified electrician to certify the system before use. In most countries, you will also need all the components used in your solar installation to be certified as suitable for grid installation. If you are planning grid-tie, budget around £2.00-£3.00 ($3.10-$4.60 US) per watt, +/- 15%.
For our holiday home installation, we need 320 watts of solar electricity if we tilt the solar panels towards the sun, or 456 watts if we mount the panels flat. Our rough estimate suggests a total system cost of around £1,280 ($1,970 US), +/- 15% for tilted panels, or £1,824 ($2,800 US) +/- 15% for a flat panel installation.
If you remember, the cost to connect this holiday home to a conventional electricity supply was £4,500 ($7,200). Therefore, installing solar energy is the cheaper option for providing electricity for our home.
What if the figures do not add up?
In some installations, you will get to this stage and find out that a solar electric system simply is unaffordable. This is not uncommon. I was asked to calculate the viability for using 100% solar energy at an industrial unit once, and came up with a ballpark figure of £33½m (around $54m)!
When this happens, you can do one of two things: walk away, or go back to your original scope and see what can be changed.
The best thing to do is go back to the original power analysis and see what savings you can make. Look at the efficiencies of the equipment you are using and see if you can make savings by using lower-energy equipment or changing the way equipment is used.
If you are absolutely determined to implement a solar electric system, there is usually a way to do it. However, you may need to be ruthless as to what you have to leave out.
In the example of the industrial unit, the underlying requirement was to provide emergency lighting and power for a cluster of computer servers if there was a power cut. The cost for implementing this system was around £32,500 ($52,000): comparable in cost to installing and maintaining on-site emergency generators and UPS equipment.
Working out dimensions
Now we know the capacity of the solar panels, we can work out an approximate size of our solar array. This is extremely useful information to know before we carry out our site survey: the solar panels have to go somewhere. We need to be able to find enough suitable space for them where they will receive uninterrupted sunshine in a safe location.
There are two main technologies of solar panels on the market: amorphous and crystalline solar panels. I will explain the characteristics and the advantages and disadvantages of each, later on.
For the purposes of working out how much space you’re going to need to fit the solar panels, you need to know that a 1m² (approximately 9.9 square feet) amorphous solar panel generates in the region of 60 watts, whilst a 1m² crystalline solar panel generates in the region of 160 watts.
Therefore, for our holiday home, we are looking for a location where we can fit between 5 and 7.6m² (49-75 square feet) of amorphous solar panels or 2-3m² (20-29 square feet) of crystalline solar panels.
In conclusion
· By calculating the amount of solar energy theoretically available at our site, we can calculate ballpark costs for our solar electric system
· There are various inefficiencies that must be considered when planning your system. If you do not take these into account, your system may not generate enough power
· It is not unusual for these ballpark costs to be far too expensive on your first attempt. The answer is to look closely at your original scope and see what can be cut in order to produce a cost-effective solution
· As well as working out ballpark costs, these calculations also help us work out the approximate dimensions of the solar array. This means we know how much space we need to find when we are carrying out a site survey