ESCAPING FROM PREDATORS An Integrative View of Escape Decisions (2015)
Part III Related behaviors and other factors influencing escape
12 Sensory systems and escape behavior
Luke P. Tyrrell and Esteban Fernández-Juricic
12.1 Sensory systems are at the center of predator-prey interactions
Despite being on opposite sides of the arms race, predators and prey share a common goal: detecting each other as early as possible. Early detection is important for prey so they can initiate their escape behavior and increase their chances of survival. Early detection is also important for predators so they can take advantage of the surprise factor and enhance the chances of prey capture. We can then expect selection pressures on the predator and prey sensory systems to enhance the chances of mutual detection (Cronin 2005). For example, the sand cricket filiform hairs, which detect air movements, are especially sensitive to the frequencies and velocities that its predators produce (Magal et al. 2006).
We review, from a mechanistic perspective, how sensory system configuration can influence antipredator behavior. For the sake of space, we focus on the visual system of vertebrate prey (see also the electronic supplementary material for a discussion on other sensory modalities), but some of the fundamental ideas can be extended to other sensory modalities (e.g., Phelps 2007). Within the visual system, several dimensions have been implicated in the responses of prey to predators: configuration of the visual fields (the degree of visual coverage around the prey’s head), spatial visual resolution (visual acuity), temporal visual resolution (how fast the retina can process temporal changes in visual stimuli), the type and number of centers of acute vision in the retina (retinal specialization), visual contrast (ability to resolve a stimulus against the background), motion detection, etc. We will discuss the role of many of these visual dimensions in affecting the decision-making of prey under the risk of predation. This approach will allow us to draw attention to some sensory aspects that behavioral ecologists tend to inadvertently omit when designing and interpreting studies on antipredator behavior.
12.2 Steps involved in predator-prey interactions from a sensory perspective
Before prey can escape from a predator, they must first use their sensory systems to gather information about the presence of the predator as well as its behavior. Decisions to eventually escape are based on the trade-off between staying in the patch to enhance foraging/breeding benefits and leaving to reduce the risks of mortality (Krause & Ruxton 2002). Not all decisions are correct, as they may lead to false alarms, where the detected stimulus is not a predator, or it is a predator that is not in a position to attack (i.e., the predator is not hunting, has not detected the prey, is attacking a different individual, or has already captured prey). Sensory systems are expected to be configured to work in conditions that would reduce the probability of false alarms, if false alarms are costly (Beauchamp & Ruxton 2007). Consequently, sensory systems can be particularly relevant in reducing uncertainty, and thus improve escape decisions, in the following key steps of the sequence of predator-prey interactions: scanning, detection, assessment of risk, alert, and finally fleeing to cover (Figure 12.1).
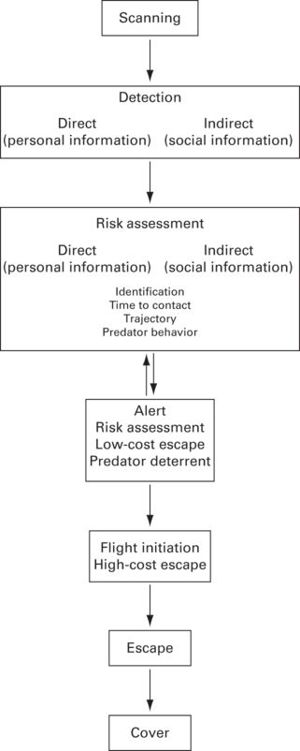
Figure 12.1
Sequence of events, from the perspective of prey, to avoid predation.
12.2.1 Scanning
From a theoretical perspective, scanning or vigilance behavior is a key parameter in antipredator behavior models (reviewed in Beauchamp 2014). An increase in scanning effort is expected to raise the probability of predator detection (e.g., Lima 1987), an assumption that has received empirical support (e.g., Cresswell et al. 2003). However, the sensory basis of scanning behavior has been less studied (Fernández-Juricic et al. 2004; Fernández-Juricic 2012).
Old models (and some new ones) make the simplistic assumption, from a purely behavioral perspective, that scanning is restricted to some body postures (Fernández-Juricic et al. 2004). More specifically, animals can only scan when head-up, but not when head-down searching for food or pecking (i.e., mutual exclusivity assumption). From a sensory perspective, this assumption does not apply to those species with laterally placed eyes (most vertebrates). The reason is because the large degree of visual coverage (i.e., wide lateral visual fields) would allow vertebrates with laterally placed eyes to engage in scanning behavior even when head down (e.g., Fernández-Juricic et al. 2008; Figure 12.2). Even more compelling is the fact that in some bird species, the center of acute vision in the retina projects laterally in head-down postures (Dolan & Fernández-Juricic 2010; Figure 12.2). Actually, there is empirical evidence in at least three bird species that the probability of predator detection in head-down body postures is not 0%, as assumed, but actually around 30% in pecking postures and 75% in food-searching postures (Lima & Bednekoff 1999; Tisdale & Fernández-Juricic 2009).
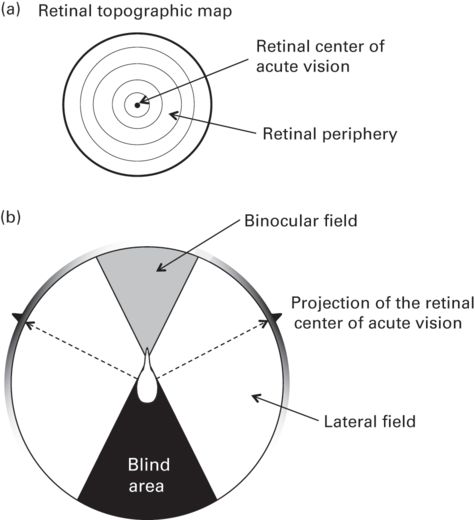
Figure 12.2
Retinal and visual field configuration. (a) Retinal topographic map showing changes in retinal cell density (photoreceptors, ganglion cells) with isoclines. In this schematic representation, cell density increases from the retinal periphery toward the center of the retina where the spot of highest cell density lies (i.e., center of acute vision). The center of acute vision will provide higher visual resolution than the retinal periphery (see Figure 12.3 for an example). (b) Top-view schematic representation of the visual field configuration of a bird. The binocular field represents the overlap of the lateral fields of the right and left eyes and the blind area at the rear of the head provides no visual input. The center of acute vision projects into the lateral fields but not into the binocular field. Also shown in grayscale are the changes in retinal cell density (photoreceptors, ganglion cells) around the visual field (darker values indicate higher cell densities).
Some may argue that even though this sensory assumption is not realistic, it may be valid enough for modeling purposes. However, model predictions can change substantially when this assumption is relaxed. For instance, the frequency of different group foraging strategies (producers, scroungers, opportunists) changes depending on the degree of visual coverage of a species (Fernández-Juricic et al. 2004). This is relevant because there is substantial variation between species in visual coverage (e.g., Martin 2014). Overall, modeling with assumptions that do not reflect the sensory systems of study species largely constrains our ability to develop predictions that can be tested empirically and makes our interpretations of the empirical results more challenging.
The mutual-exclusivity assumption has deeply shaped the way in which behavioral biologists measure scanning behavior (Caro 2005). The most commonly recorded parameters have been (a) the rate at which an animal goes head-up from a head-down position (e.g., scanning rate), and (b) the duration of time (raw or proportional) the animal stays in the head-up position (e.g., scan bout length). However, while the animal is head-up, it cannot gather information 360° around its head due to the constraints imposed by its visual field configuration (i.e., blind area at the rear of the head; Figure 12.2). For instance, in some studies comparing two species, the one with a wider blind area allocated more time to head-up scanning (Guillemain et al. 2002; Tisdale & Fernández-Juricic 2009) likely to compensate for the lower detection ability at the back of its head (Kaby & Lind 2003; Devereux et al. 2006). A new scanning metric has been proposed, head movement rate, which is more sensory based because it captures the process of using vision for information gathering while head-up, particularly in species with laterally-placed eyes (Jones et al. 2007; Fernández-Juricic et al. 2011a; Fernández-Juricic 2012). To better interpret the variation in head-movement behavior, we need to understand some basic properties of the vertebrate eye.
From a visual perspective, scanning while head-up (i.e., through head movements) is similar to a visual search task that involves searching for an object of interest (a predator) in the visual background when that object is not detectable (Land 1999). Visual search is akin to taking a sequence of snapshots (one per each head or eye position) around the head with each retina. Every snapshot, however, is not like a regular picture with high definition throughout it (Figure 12.3). The retina is configured in such a way that there is usually (at least) one area of acute vision (e.g., a fovea) surrounded by areas that provide less acute vision (the retinal periphery; Figure 12.2). The center of acute vision generally has a high density of cones (which work under daylight conditions) and a low density of rods (which work at night) (McIlwain 1996). The periphery of the retina usually has the reversed pattern of cone vs. rod photoreceptor density. Cones and rods transfer the information from the retina to the visual centers of the brain through the retinal ganglion cells, whose nuclei are part of the retina and whose axons form the optic nerve (McIlwain 1996).
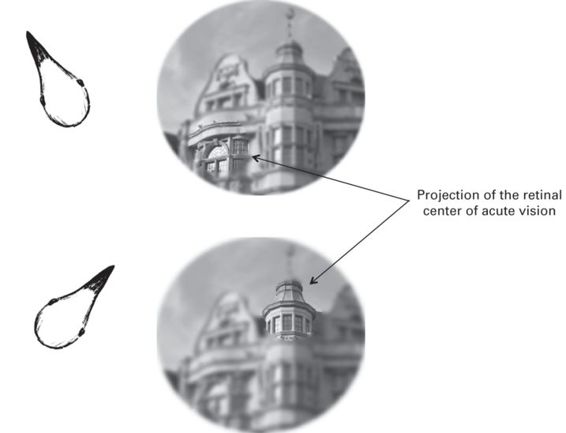
Figure 12.3
Schematic representation of how changes in head position vary the spatial position of the projection of the retinal center of acute vision for right lateral visual field. The center of acute vision provides high-quality visual information, but the retinal periphery provides lower quality information due to variations in the cell density (photoreceptors, ganglion cells) across the retina (see Figure 12.2).
In general, the relative size of the retinal center of acute vision is much smaller than the rest of the retina (Figure 12.2). This means that at each snapshot obtained by the retina, a small proportion of the visual space is at high resolution, but most of it is at low resolution (Figure 12.3). The behavioral implication is that animals need to move the retinas around to get a sufficient number of snapshots with high visual resolution per unit time to cover the visual space around their heads (Figure 12.3). The retinas are moved around through eye and/or head movements. In general, head-movement rates increase when the perceived risk of predation increases, likely to visually search more actively for the position of the potential threat (Fernández-Juricic et al. 2011a; Randolet et al. 2014).
Recent studies have suggested that variation in the density of photoreceptors and retinal ganglion cells from the retinal periphery to the retinal center of acute vision (Figure 12.2) could influence scanning behavior (Dolan & Fernández-Juricic 2010). These changes in cell density across the retina are known as cell density profiles, and can take different shapes (Figure 12.4). For instance, a steep change in cell density (Figure 12.2a) would make individuals rely mostly on their retinal center of acute vision (rather than the periphery) to gather information, which could increase the rate of eye/head movements to gather sufficient high-quality visual information per unit time. On the other hand, a shallow change in cell density (Figure 12.2b) would allow individuals to rely not only on their center of acute vision, but also partly on the retinal periphery, providing a larger proportion of retina with high-quality visual information, thereby reducing the rate of eye/head movements. For instance, California towhees Melozone crissalis, with relatively steeper cell density profiles, have been shown to have higher head movement rates than white-crowned sparrows Zonotrichia leucophrys, which have relatively shallower cell density profiles (Fernández-Juricic et al. 2011b). This type of variation in retinal configuration could have implications for head-up scanning and hence predator detection. For instance, if a species with a steep retinal cell density profile reduces its eye/head movement rate, it could decrease the chances of predator detection because of the fewer retinal snapshots collected per unit time and the smaller retinal area with high visual resolution within each snapshot (Fernández-Juricic 2012; Figure 12.3).
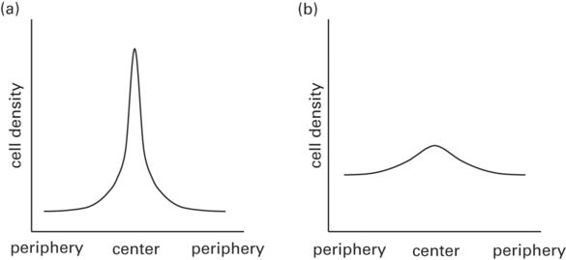
Figure 12.4
Schematic representation of cell density profiles across the retina (i.e., photoreceptors/ganglion cells). (a) Steep cell-density profiles have high peak cell densities within the center of acute vision, but decrease rapidly toward the retinal periphery. At a given eye size, steep cell-density profiles are expected to provide high visual resolution in a small retinal area, but lower resolution in the periphery. (b) Shallow cell-density profiles generally have relatively lower peak cell densities within the center of acute vision, but cell densities decrease slowly toward the retinal periphery. At a given eye size, shallow cell-density profiles are expected to provide high visual resolution over a relatively larger retinal area, with a comparatively lower change in visual resolution from the periphery to the center of acute vision.
12.2.2 Detection
The sensory capabilities of an animal are likely to influence three aspects of predator detection: (1) the probability of early predator detection; (2) the maximum detection distance; and (3) the average detection distance (Figure 12.5a). Maximum detection distance refers to the distance at which prey could detect a given predator with its acute center of vision (high-quality information), whereas average detection distance refers to the average distance at which prey could detect a given predator with any part of the retina (high- and low-quality information pooled together). There are two relevant visual resolution dimensions that may affect these three aspects of predator detection, but not necessarily in the same way. First, detection has been proposed to depend on overall visual resolution (Tisdale & Fernández-Juricic 2009), which refers to the average resolution across the whole visual field as determined by the size of the eye (i.e., larger eyes have higher acuity, Pettigrew et al. 1988) and the average density of photoreceptors/ganglion cells across the whole retina. Second, detection has been proposed to depend on cell-density profiles, which are determined by the variation in relative cell density between the retinal center of acute vision and the retinal periphery (Dolan & Fernández-Juricic 2010, Fernández-Juricic et al. 2011b; Fernández-Juricic 2012; Figure 12.4).
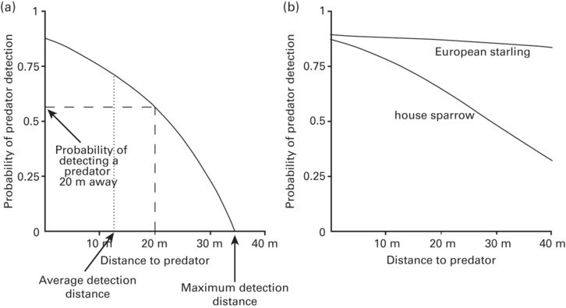
Figure 12.5
Probability of predator detection as a function of distance to predator. (a) The probability of detecting a predator (y) can be calculated for any given distance (x). The non-linear nature of the relationship is due to the non-linear decrease in visual contrast over distance. When the area under the curve is equal on both sides of the dotted line, the dotted line represents the average detection distance. (b) Empirical data showing higher detection probabilities over greater distances in the European starling (high overall visual resolution) than the house sparrow (low overall visual resolution).
(Figure adapted from Tisdale & Fernández-Juricic 2009).
We propose a novel way of representing in space how the visual configuration can influence detection behavior with spatial detection maps, which can be particularly useful to predict spatial variations in perceived predation risk for different species (Figure 12.6). Spatial detection maps provide a top-view schematic representation of the areas around the animal where the probabilities of predator detection are higher as a function of (a) the configuration of the visual fields; (b) the position of the centers of acute vision; (c) the cell-density profiles; and (d) the variation in visual contrast and resolution with distance. Spatial detection maps are bounded by the maximum detection distance for any given area of the visual field (black continuous line in Figure 12.6), which is estimated based on the limits of visual resolution by eye size and cell density. The maximum detection distance is expected to vary in different parts of the visual field (binocular, lateral, blind areas), reflecting changes in cell density across the retina (Figures 12.2, 12.4). The highest values of the maximum detection distance (farthest detection point from the prey) are constrained in space and given by the projections of the centers of acute vision into visual space (Figure 12.6). Average detection distance for any given position in the visual field is represented by the dotted line inside the detection map. The probability of detection at any given point within the spatial detection map is represented by grayscale shading (Figure 12.6) and represents the decrease in visual contrast and visual resolution with increasing distances (Tisdale & Fernández-Juricic 2009). The probability of detection within a given distance range is represented by the proportional area of that range within the spatial detection map weighted by the average probability of detection within that distance range.
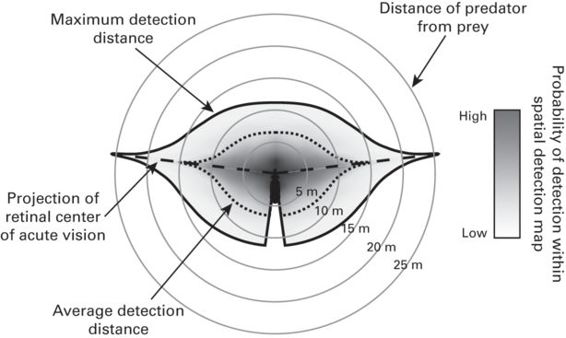
Figure 12.6
Spatial detection map. The solid gray lines provide a scale for the distance from the prey. The maximum detection distance a prey (center) is capable of, for a given predator, is bounded by the solid black line. The grayscale within the detection map represents the probability of detection at any given location within the detection map. The dotted line corresponds to the average detection distance around the prey, and the dashed line represents the projection of the prey’s retinal center of acute vision.
We can make predictions on the variations in the shape of spatial detection maps based on some of the visual properties discussed in the previous section (Figure 12.7). For the sake of clarity, we present different scenarios, but without considering changes in the probability of detection within the spatial detection maps (grayscale in Figure 12.6).
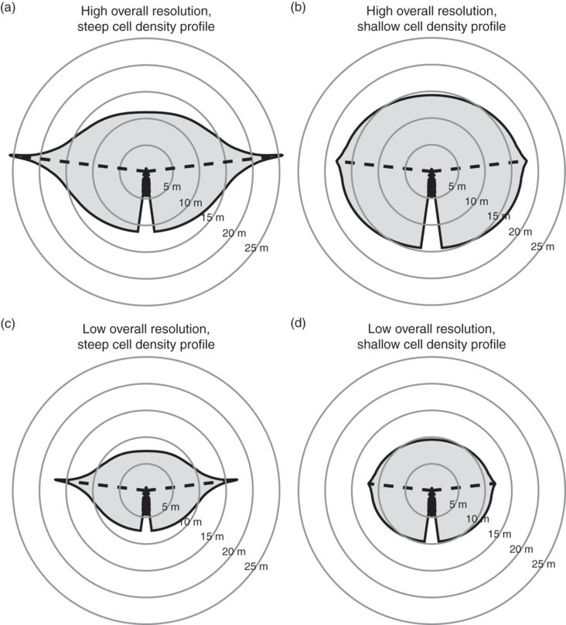
Figure 12.7
Hypothetical spatial detection maps for animals with (a) high overall visual resolution and steep cell-density profile; (b) high overall resolution and shallow cell-density profile; (c) low overall resolution and steep profile; and (d) low overall resolution and shallow profile. Blind areas were kept constant for clarity purposes.
Species with higher overall visual resolution are expected to have greater probability of predator detection and greater maximum and average detection distances because they can see predators from farther away (Kiltie 2000; Tisdale & Fernández-Juricic 2009). For example, Tisdale and Fernández-Juricic (2009) found that European starlings Sturnus vulgaris (overall visual resolution = 5.9 cycles/degree; Dolan & Fernández-Juricic 2010) have higher probabilities of detection and greater detection distances than house sparrows Passer domesticus (overall visual resolution = 4.5 cycles/degree; Dolan & Fernández-Juricic 2010; Figure 12.5b). Differences in overall visual resolution between species can be translated into spatial detection maps. For instance, consider scenarios (b) and (d) in Figure 12.7. Scenario (b) represents an individual with higher overall visual resolution than that in scenario (d), which translates into maximum detection distances around 18 m and average detection distances around 15 m for (b) and 12 m and 10 m, respectively, for (d). Likewise, the detection map in (b) covers 92% of the area between 10 and 15 m, suggesting a high probability of detecting a predator that appears anywhere between 10 and 15 m. In scenario (d), on the other hand, the detection map only covers 8% of the area between 10 and 15 m, giving the individual a much lower probability of predator detection.
Species with steep cell-density profiles are expected to have greater maximum detection distances than species with shallow cell-density profiles, but similar average detection distances assuming that species do not vary in overall (or average) visual resolution. To illustrate these predictions, Figure 12.7a shows a species with a steep cell-density profile and Figure 12.7b one with a shallow density profile. Scenario (a) portrays a maximum detection distance greater than 25 m, whereas in scenario (b) maximum detection distance is around 18 m. Both (a) and (b) have average detection distances around 15 m, but those averages come about in very different ways. In scenario (b), the detection distance is relatively consistent throughout the visual field, whereas in scenario (a) detection distance is higher in the parts of the visual field subtended by the centers of acute vision and lower in the parts of the visual field subtended by the retinal periphery. The inconsistency in detection distances could lead to the species in scenario (a) actually having lower probability of early detection. While the species in scenario (a) could potentially detect a predator from greater than 25 m away, it only has a 56% probability of detecting a predator that appears 10 to 15 m away, compared to 92% for the species in scenario (b). Therefore prey with steep cell-density profiles (Figure 12.7a) are expected to become more reliant on their centers of acute vision for predator detection. This retinal configuration may be most advantageous in environments where predators approach from predictable locations that can be consistently monitored. For example, many predators attack from cover (Lima et al. 1987; Roth & Lima 2007), and therefore prey in habitats with limited cover can focus on monitoring only the most likely areas of attack. On the other hand, shallow cell-density profiles may be more advantageous for detecting predators that could come from anywhere (Hughes 1977).
Prey with wider visual fields, and thus smaller blind areas, are expected to have higher probabilities of predator detection because they can see more of their environment at any given time than prey with narrower visual fields (Fernández-Juricic et al. 2004; Tisdale & Fernández-Juricic 2009). For instance, blue tits, Cyanistes cyaneus, have a lower probability of detection when a predator appears in their blind areas (Kaby & Lind 2003). Figure 12.8 shows why prey with narrower blind areas would be able to detect a predator in more different head orientations than a prey with wider blind areas.
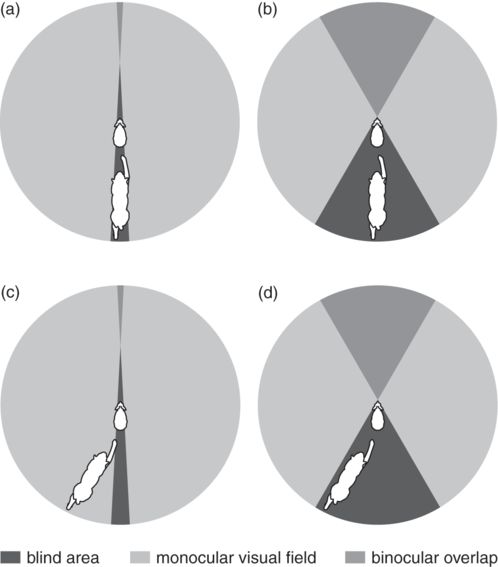
Figure 12.8
Eyes in the back of the head. The circles in this figure represent the visual field parameters, as viewed from above, of two hypothetical hares (at center of the circle) when being chased by a lynx (at bottom of the circle). (a) A hare with a small blind area can partially see a predator directly behind it. (b) A hare with a large blind area cannot see a predator directly behind. (c) A hare with a small blind area can see a predator in a more lateral position. (d) A hare with a large blind area cannot always see the predator, even when the predator is not directly behind it.
Prey that are more sensitive to motion are also expected to be better able to detect predator movements and thus have higher probabilities of early detection. There are two independent mechanisms that each could yield greater motion detection ability: temporal visual resolution and the abundance of photoreceptors associated with motion vision. A higher temporal visual resolution is the result of shorter photoreceptor integration times yielding more frequent updating of the visual image on the retina (Legge 1978). Therefore temporal visual resolution plays a major role in motion detection, especially in detecting fast moving objects (Lappin et al. 2009) such as predators. Avian double cone photoreceptors have been associated with motion-detection ability in studies using physiological (von Campenhausen & Kirschfeld 1998) and behavioral approaches (Goldsmith & Butler 2005). Double cones are abundant in most vertebrate retinas (Walls 1942; Bowmaker 1990; Hart 2001a). In European starlings, for example, double cones outnumber all four types of single cones combined (Hart et al. 1998). More double cones in the retina would confer more acute motion detection ability because a moving image would pass across more double cone photoreceptors per unit time. For example, bird species that have unobstructed overhead vision (in open habitats) have more double cones in the ventral retina, which projects upward, where aerial predators are likely to come from; whereas species with obstructed overhead vision (e.g., arboreal species with branches overhead) have more double cones in the dorsal retina, which projects downward, where ground predators would initiate attacks (Hart 2001b). We expect visual systems with higher temporal visual resolution or more double cones to be more sensitive to motion and increase the probability of early predator detection.
Ultimately, the brain prioritizes how the different components of the information gathered by the visual system are processed through attention mechanisms, which involve selectively allocating cognitive resources to a specific portion of visual field with specific stimuli. Attention is limited because the amount of information received by the sensory systems is greater than the amount of information that can be processed by the brain (Milinski 1990; Kastner & Ungerleider 2000; Dukas 2002). The probability of detection is expected to decrease when an individual is not allocating attention to the sensory modality or region of sensory space within the modality where the predator becomes detectable (Dukas 2002). Interestingly, there are two main attention mechanisms that occur in different parts of the retina (center of acute vision vs. retinal periphery). Overt visual attention takes place with the center of acute vision, whereas covert visual attention occurs in the retinal periphery (Bisley 2011). Animals often use overt visual attention; for instance, if a moving stimulus is detected with the retinal periphery, the eye/head will move very quickly to align the center of acute vision with that stimulus to obtain an image with higher visual resolution (hence, higher information quality; Zani & Proverbio 2012; Yorzinski & Platt 2014; Figure 12.3). For example, peafowl, Pavo cristatus, appear to inspect model predators with their centers of acute vision after detection with the retinal periphery (Yorzinski & Platt 2014).
The allocation of cognitive resources between overt and covert attention could also vary with the nature of the task, and ultimately influence predator detection. For instance, blue jays, Cyanocitta cristata, focused on solving a complex task (e.g., discriminating prey from a visually complex background) have more difficulty detecting predators elsewhere in their visual fields (Dukas & Kamil 2000). This effect could be the result of an increase in overt attention at the expense of covert attention. Additionally, in species with laterally placed eyes, individuals appear to attend to only one eye at a time and simultaneously suppress input from the unattended eye. However, information processing still occurs in the retina of the unattended eye because suppression acts on specific visual centers in the brain (tectofugal pathway), not on the retina itself (Engelage & Bischof 1988; Voss & Bischof 2003). Therefore the appearance of a salient object in the visual field of the unattended eye may be able to override the central suppression and redirect attention to the previously unattended eye (Voss & Bischof 2003). If this is the case, a predator moving across the visual field of an unattended eye is more likely to override attentional suppression if the prey species has a greater abundance of motion sensitive photoreceptors because the predator’s movement will stimulate more photoreceptors.
12.2.3 Assessing predation risk
After a stimulus has been detected, the sensory systems are far from done. Prey continue gathering information with their sensory systems to assess the risk of a potential threat. Prey modify their perception of risk depending on predator identity, predator behavior, how long they have before the predator can strike, and if detected through conspecifics/heterospecifics, whether a predator is even present (Lima & Dill 1990). Escape behaviors are energetically costly and, perhaps more importantly, reduce foraging and mating opportunities. Fitness-wise, it would be in an animal’s best interest to only flee when the probability of mortality is high. To that end, sensory systems that gather information more accurately are expected to reduce the incidence of mistakes when deciding on an escape response, and sensory systems that gather information more quickly or from greater distances are expected to give prey more time to respond to a predator.
From a sensory perspective, it is not totally clear how assessment translates into behavioral changes. One of the reasons is that an individual may be engaged in both sensory assessment and other activities (e.g., foraging) simultaneously without necessarily modifying its behavior. For instance, given the wide visual field of birds and the lateral projection of the foveae in many species (Fernández-Juricic 2012), it is likely that birds could assess a potential threat from a head-down body posture if the risk is not too high. Consequently, we could consider different levels of sensory assessment: low quality and high quality. Low-quality sensory assessment is expected to occur when the animal is in a body posture not intended for gaining a large amount of information about the threat (e.g., head down) and/or using portions of the visual field that do not provide high visual resolution (e.g., retinal periphery). High-quality assessment, on the other hand, is expected in head-up body postures and/or using the centers of acute vision as individuals can enhance the amount and quality of visual information obtained. For example, Sceloporus lizards that detect predators with the peripheral retina flee a short distance to put space between themselves and the predator, then stop and assess the predation risk with high-quality information before seeking cover (Cooper 2008). The implication is that establishing the duration of assessment (and consequently its costs) would require measurements that go beyond classic behavioral responses (Cresswell et al. 2009) and consider the sensory systems of the study species (e.g., eye-tracking for birds; Yorzinski & Platt 2014; Tyrrell et al. 2014).
A major step in assessing predation risk is the identification of a detected stimulus as a predator or a non-predator. Identification requires a sufficient level of sensory acuity to distinguish certain characteristics of the stimulus. For example, mallards Anas platyrhynchos characterize a silhouette with a short neck and long tail as a predator (e.g., a hawk) and a silhouette with a long neck and short tail as a non-predator (e.g., a goose) (Green et al. 1968). Identification of predators is likely to be dependent on the centers of acute vision because prey orient them toward predators (after detection) rather than assessing the predator with the retinal periphery (Yorzinski & Platt 2014). Therefore, species with higher localized visual resolution are expected to have higher identification distances. Additionally, because predators that are farther away take more time to reach prey, higher localized visual resolution would allow prey to gather information for longer times before making decisions to flee. The distance at which an animal detects a stimulus (hereafter, detection distance) will be greater than the distance at which it can identify the stimulus (hereafter, identification distance). Prey may not react to a predator until it is close enough to identify, or prey may actually approach the predator to identify it (Magurran & Girling 1986).
In addition to identification, prey estimate time to contact (the amount of time it will take the predator to reach the prey’s current position), trajectory (whether the predator is approaching the prey directly or tangentially), and the motivational state of the predator to assess the actual risk of predation (Lima & Dill 1990). Time to contact informs the prey how long it has before it can no longer safely flee to cover (Regan & Vincent 1995). In the visual system, time to contact and predator trajectory appear to be estimated by the rate and symmetry of image expansion on the retina, respectively (looming; Regan & Vincent 1995). As an object approaches the viewer, the image of that object will expand on the retina. Faster rates of image expansion correspond to objects that will come in contact with the viewer more quickly. If the image expands symmetrically, the object can be interpreted as approaching the viewer directly. If the image expands asymmetrically, the object is approaching at an angle, and it is moving slightly sideways in the direction of greater expansion rather than directly toward the viewer. There is evidence across many taxa that animals associate looming stimuli with predation (Schaller & Emlen 1962; Schiff 1965; Hassenstein & Hustert 1999; Carlile et al. 2006).
12.2.4 Alert and escape
Most animals display some kind of alert behavior (e.g., cease foraging, head movement, extended neck) after detection, but before fleeing. Alert distance has been associated with the detection of a threat (Fernández-Juricic & Schroeder 2003; Blumstein et al. 2005). The rationale is that prey are expected to switch to an alert posture (i.e., from foraging head-down to scanning head-up) immediately after detection. This leads to the prediction that alert distance (AD) would be similar to detection distance. However, a recent study considering the visual system of prey has challenged this view. Blackwell et al. (2009) estimated detection distances of brown-headed cowbirds and mourning doves Zenaida macroura based on eye size and the density of retinal ganglion cells as 1012 m and 1363 m, respectively (under optimal light conditions). The authors also measured ADs behaviorally toward a vehicle approaching them directly, and found that they were an order of magnitude smaller (71 m and 105 m, respectively). This suggests that animals detect early but do not show alert behaviors until later in the approach sequence. The two implications are that (a) sensory detection is difficult to measure behaviorally, and (b) detection and alert distances are not necessarily identical.
Another metric that has been linked to detection and alert is starting distance (SD). Some papers have explicitly assumed that SD is higher than AD (i.e., prey do not exhibit alert before the approach begins; Dumont et al. 2012). Such assumptions consider that SD is higher than detection distance. However, as mentioned before, detection distance may be greater than SD and different sensory configurations could lead to different probabilities of detection after the approach begins. Violating these assumptions may lead to erroneous interpretations of the decision-making processes involved in antipredator responses.
Alert behaviors themselves may function as an assessment phase (Cresswell et al. 2009), but for the most part, the sensory functions of alert have not been empirically tested. We do not know when the prey gathers much of the information used for assessment, but it is possible that such information is gathered before becoming alert, after becoming alert, or both. The timing of risk assessment in relation to alert behavior could lead to different functions and costs of alert behavior, as well as differences in the expected slopes of the positive relationship observed between AD and FID (Blumstein et al. 2005; Dumont et al. 2012).
If risk assessment occurs after prey display overt alert behaviors, then the function of alert may be stabilization of gaze to visually track the predator and gather information to estimate risk. In this case, alert becomes a costly activity as it diverts attention and time from foraging. If assessment requires a certain amount of time, then we would predict a shallower slope in the positive relationship between AD and FID (Blumstein et al. 2005; Dumont et al.2012), all else being equal. The reason is because the time invested in alert would constrain the time the individual has to flee.
The opposite scenario is that an individual assesses risk before becoming overtly alert. In this case, alert behavior might not serve a sensory function at all, but rather it is simply a signal to the predator reflecting that the prey is aware of its presence (e.g., pursuit detterence; Hasson 2000; Caro 2005) or a low-cost escape attempt (e.g., becoming stationary to reduce movement cues about its position; Misslin 2003) before the individual resorts to a high-cost escape attempt. This scenario would lead to a steeper slope in the positive relationship between AD and FID (Blumstein et al. 2005; Dumont et al. 2012), all else being equal. Individuals would be able to quickly flee right after alert, if the situation is risky enough, without investing time in assessment at that point.
A third scenario is that prey have acquired some limited measure of risk assessment before displaying alert behavior. For instance, before becoming alert, an individual could gather some low-quality information while in a head-down posture or with the periphery of the retina. This initial low-quality stage will have low attention costs, allowing the individual to continue with other important tasks (e.g., foraging). By having some limited information available before devoting a large amount of sensory resources to the predator, individuals would be able to make an initial decision as to whether the predator was threatening enough to become alert or not. After making the decision to become alert, individuals would then be able to gather higher quality information while head-up and with the centers of acute vision (Yorzinski & Platt 2014). The higher quality assessment phase would obviously have higher attention costs (Blumstein 2010), but would allow for a more accurate estimation of the level of risk before escaping or resuming foraging. This scenario would lead to an intermediate slope in the positive relationship between AD and FID (Blumstein et al. 2005; Dumont et al. 2012), all else being equal, because low- and high-quality assessment may require certain amounts of time.
12.3 Implications for predator-prey interactions
From a sensory perspective, the prey’s ultimate goal is to detect predators before being detected and to assess their level of risk to determine if they are (1) in danger and should flee, or (2) safe from predation and should resume other activities. However, there appears to be variability between prey species in detection distances due to the configuration of the sensory systems (Kiltie 2000). Prey with greater long-distance sensory detection abilities can gather information for a longer period of time before making a decision to flee (Figure 12.9a). However, prey with short-distance sensory detection abilities will have less time to gather the same information (Figure 12.9b), potentially leading to a scenario where time to contact is shorter than the time it takes to identify and flee from a predator (Figure 12.9c). This brings up an interesting question: how do species with more constrained sensory systems successfully avoid predators? There is a continuum of potential (non-mutually exclusive) explanations that should be investigated in the future. On one end of the continuum, prey with more constrained sensory systems and thus less time to engage in assessment may trade-off with other sensory modalities (or dimensions within a given modality) or components of the antipredator behavior sequence (Figure 12.1). For instance, species with smaller body mass tend to have lower spatial visual resolution because of smaller eye sizes (Kiltie 2000), reducing detection distances, and hence detection times (Figure 12.9b). However, a recent study found that smaller species have higher temporal visual resolution (Healy et al. 2013), which suggests that they may be able to get necessary information about a predator in a shorter period of time because they can gather information at a faster rate. Alternatively, species with more constrained sensory systems may have enhanced escape abilities. For example, cockroaches that detect predators at very close range (Figure 12.9c) have exceptionally quick response times (Camhi et al. 1978). Because cockroaches can escape so quickly, early detection becomes less important. On the other end of the continuum, species may forgo assessment completely and flee as soon as a predator is detected (Figure 12.9c; Blumstein, 2010).
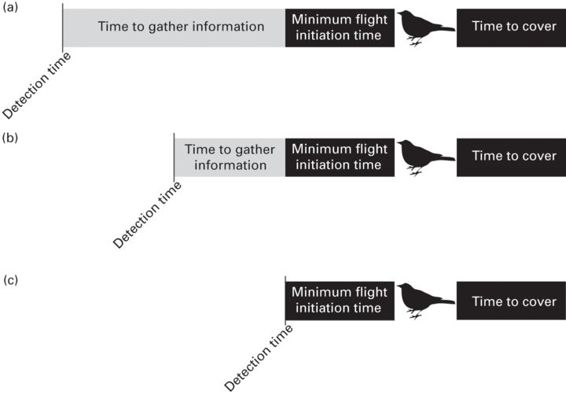
Figure 12.9
Sensory systems can influence the ability to make correct decisions when assessing predation risk. In this figure, detection time refers to the moment the prey first detects a potential predator. The length of the black bar to the right of the bird represents the amount of time it will take for the bird to flee to cover. The black bar to the left of the bird (minimum flight initiation time) represents the last possible moment in time that the bird can safely flee to cover. The length of the gray bar represents the amount of time the bird has to assess the likelihood of an attack. Species with more sensitive or acute sensory organs (a) can detect potential predators sooner, and therefore have more time to gather additional information than prey whose sensory organs have lower detection ranges (b). For a prey whose sensory organs do not detect the predator until close to minimum flight initiation time (e.g., surprise predator attack), detection time must be only slightly greater than or equal to minimum flight initiation time if the prey is to escape (c).
Different hypotheses have been proposed to explain the rules animals may follow when making the decision to stay and assess or to flee. The perceptual limits hypothesis, for example, predicts that species will detect a predator and immediately flee (Quinn & Cresswell 2005). From a sensory perspective, the perceptual limits hypothesis excludes the risk-assessment phase. Therefore, the relevant sensory dimensions that influence the prey response would be those contributing to detection of predators (see above). Other hypotheses, however, make different predictions but consider a risk-assessment phase. The economic hypothesis predicts that prey will delay fleeing until the risk of predation outweighs the benefits of continuing other tasks (Ydenberg & Dill 1986). The optimality hypothesis is similar to the economic hypothesis, but predicts that prey will flee when the accrued fitness gains from staying are optimized, whereas the economic hypothesis predicts flight when fitness gains and losses break even (Cooper and Frederick 2007). The flush early and avoid the rush (FEAR) hypothesis predicts that prey will only delay fleeing for a short time because the attention costs of tracking a predator can outweigh the costs of fleeing early and losing foraging time (Blumstein 2010). Therefore the major difference between the optimality and FEAR hypotheses is the cost of attention associated with the risk-assessment phase (Cooper & Blumstein 2014). From a sensory perspective, we could expect species that can minimize the attention costs associated with risk assessment (e.g., wide visual fields that can take advantage of tracking the predator with the periphery of the retina through lateral vision while simultaneously engaging in other tasks) to fall on the optimality hypothesis end of the spectrum. Conversely, species with very high attention costs (e.g., narrow visual fields that require ceasing other tasks to track the predator with the centers of acute vision) would fall on the FEAR hypothesis end of the spectrum.
Overall, many of the sensory mechanisms underlying predator-prey interactions remain poorly understood, presenting a largely unexplored avenue to investigate many proximate as well as ultimate questions about the sensory basis for escape behavior. Future studies could also benefit from a comparative approach to understand the important environmental factors that drive differences in the sensory ecology and antipredator behaviors across taxa.
References
Beauchamp, G. (2014). Social Predation: How Group Living Benefits Predators and Prey. London: Academic Press.
Beauchamp, G. & Ruxton, G. D. (2007). False alarms and the evolution of antipredator vigilance. Animal Behaviour, 74, 1199-1206.
Bisley, J. W. (2011). The neural basis of visual attention. Journal of Physiology, 589, 49-57.
Blackwell, B. F., Fernández-Juricic, E., Seamans, T. W. & Dolan, T. (2009). Avian visual system configuration and behavioural response to object approach. Animal Behaviour, 77, 673-684.
Blumstein, D. T. (2010). Flush early and avoid the rush: a general rule of antipredator behavior? Behavioral Ecology, 21, 440-442.
Blumstein, D. T., Fernández-Juricic, E., Zollner, P. A. & Garity, S. C. (2005). Inter-specific variation in avian responses to human disturbance. Journal of Applied Ecology, 42, 943-953.
Bowmaker, J. K. (1990). Visual pigments of fishes. In Douglas, R. H. & Djamgoz, M. B. A. (eds.) The Visual System of Fish. London: Chapman and Hall, pp. 81-104.
Camhi, J. M., Tom, W. & Volman, S. (1978). The escape behavior of the cockroach Periplaneta americana. Journal of Comparative Physiology A, 12, 203-212.
Carlile, P. A., Peters, R. A. & Evans, C. S. (2006). Detection of a looming stimulus by the Jacky dragon: Selective sensitivity to characteristics of an aerial predator. Animal Behaviour, 72, 553-562.
Caro, T. (2005). Antipredator Defenses in Birds and Mammals. Chicago, IL: University of Chicago Press.
Cooper, W. E. Jr. (2008). Visual monitoring of predators: occurrence, cost and benefit for escape. Animal Behaviour, 76, 1365-1372.
Cooper, W. E. Jr. & Blumstein, D. T. (2014). Novel effects of monitoring predators on costs of fleeing and not fleeing explain flushing early in economic escape theory. Behavioral Ecology, 25, 44-52.
Cooper, W. E. Jr. & Frederick, W. G. (2007). Optimal flight initiation distance. Journal of Theoretical Biology, 244, 59-67.
Cresswell, W., Quinn, J. L., Whittingham, M. J. & Butler, S. (2003). Good foragers can also be good at detecting predators. Proceedings of the Royal Society of London B, 270, 1069-1076.
Cresswell, W., Butler, S., Whittingham, M. J. & Quinn, J. L. (2009). Very short delays prior to escape from potential predators may function efficiently as adaptive risk-assessment periods. Behaviour, 146, 795-813.
Cronin, T. W. (2005). The visual ecology of predator-prey interactions. In Barbosa, P. & Castellanos, I. (eds.) Ecology of Predator-prey Interactions. Oxford: Oxford University Press, pp. 105-138.
Devereux, C. L., Whittingham, M. J., Fernández-Juricic, E., Vickery, J. A. & Krebs, J. R. (2006). Predator detection and avoidance by starlings under differing scenarios of predation risk. Behavioral Ecology, 17, 303-309.
Dolan, T. & Fernández-Juricic, E. (2010). Retinal ganglion cell topography of five species of ground-foraging birds. Brain, Behavior and Evolution, 75, 111-121.
Dukas, R. (2002). Behavioural and ecological consequences of limited attention. Philosophical Transactions of the Royal Society B: Biological Sciences, 357, 1539-1547.
Dukas, R. & Kamil, A. C. (2000). The cost of limited attention in blue jays. Behavioral Ecology, 11, 502-506.
Dumont, F., Pasquaretta, C., Réale, D., Bogliani, G. & von Hardenberg, A. (2012). Flight initiation distance and starting distance: Biological effect or mathematical artefact? Ethology, 118, 1051-1062.
Engelage, J. & Bischof, H.-J. (1988). Enucleation enhances ipsilateral flash evoked respones in the ectostriatum of the zebra finch (Taeniopyia guttata castanotis Gould). Experimental Brain Research, 70, 79-89.
Fernández-Juricic, E. (2012). Sensory basis of vigilance behavior in birds: Synthesis and future prospects. Behavioural Processes, 89, 143-152.
Fernández-Juricic, E. & Schroeder, N. (2003). Do variations in scanning behavior affect tolerance to human disturbance? Applied Animal Behaviour Science, 84, 219-234.
Fernández-Juricic, E., Erichsen, J. T. & Kacelnik, A. (2004). Visual perception and social foraging in birds. Trends in Ecology & Evolution, 19, 25-31.
Fernández-Juricic, E., Gall, M. D., Dolan, T., Tisdale, V. & Martin, G. R. (2008). The visual fields of two ground-foraging birds, house finches and house sparrows, allow for simultaneous foraging and anti-predator vigilance. Ibis, 150, 779-787.
Fernández-Juricic, E., Gall, M. D., Dolan, T. et al. (2011a). Visual systems and vigilance behaviour of two ground-foraging avian prey species: White-crowned sparrows and California towhees. Animal Behaviour, 81, 705-713.
Fernández-Juricic, E., Beauchamp, G., Treminio, R. & Hoover, M. (2011b). Making heads turn: Association between head movements during vigilance and perceived predation risk in brown-headed cowbird flocks. Animal Behaviour, 82, 573-577.
Goldsmith, T. H. & Butler, B. K. (2005). Color vision of the budgerigar (Melopsittacus undulatus): Hue matches, tetrachromacy, and intensity discrimination. Journal of Comparative Physiology A, 191, 933-951.
Green, R., Carr, W. J. & Green, M. (1968). The hawk-goose phenomenon: Further confirmation and a search for the releaser. Journal of Psychology, 69, 271-276.
Guillemain, M., Martin, G. R. & Fritz, H. (2002). Feeding methods, visual fields and vigilance in dabbling ducks (Anatidae). Functional Ecology, 16, 522-529.
Hart, N. S. (2001a). The visual ecology of avian photoreceptors. Progress in Retinal and Eye Research, 20, 675-703.
Hart, N. S. (2001b). Variations in cone photoreceptor abundance and the visual ecology of birds. Journal Of Comparative Physiology A, 187, 685-698.
Hart, N., Partridge, J. & Cuthill, I. (1998). Visual pigments, oil droplets and cone photoreceptor distribution in the European starling (Sturnus vulgaris). Journal of Experimental Biology, 201, 1433-1446.
Hassenstein, B. & Hustert, R. (1999). Hiding responses of locusts to approaching objects. Journal of Experimental Biology, 202, 1701-1710.
Hasson, O. (2000). Knowledge, information, biases and signal assemblages. In Espmark, Y., Amundsen, T. & Rosenqvist, G. (eds.) Animal Signals: Signalling and Signal Design in Animal Communication. Trondheim: Tapir Academic Press, pp. 445-463.
Healy, K., McNally, L., Ruxton, G. D., Cooper, N. & Jackson, A. L. (2013). Metabolic rate and body size are linked with perception of temporal information. Animal Behaviour, 86, 685-696.
Hughes, A. (1977). The topography of vision in mammals of contrasting life style: Comparative optics and retinal organisation. In Crescittelli, F. (ed.) Handbook of Sensory Physiology. New York: Springer, pp. 613-756.
Jones, K. A., Krebs, J. R. & Whittingham, M. J. (2007). Vigilance in the third dimension: Head movement not scan duration varies in response to different predator models. Animal Behaviour, 74, 1181-1187.
Kaby, U. & Lind, J. (2003). What limits predator detection in blue tits (Parus caeruleus): Posture, task or orientation? Behavioral Ecology and Sociobiology, 54, 534-538.
Kastner, S. & Ungerleider, L. G. (2000). Mechanisms of visual attention in the human cortex. Annual Review of Neuroscience, 23, 315-341.
Kiltie, R. A. (2000). Scaling of visual acuity with body size in mammals and birds. Functional Ecology, 14, 226-234.
Krause, J. & Ruxton, G. D. (2002). Living in Groups. Oxford: Oxford University Press.
Land, M. F. (1999). Motion and vision: Why animals move their eyes. Journal of Comparative Physiology A, 185, 341-352.
Lappin, J. S., Tadin, D., Nyquist, J. B. & Corn, A. L. (2009). Spatial and temporal limits of motion perception across variations in speed, eccentricity, and low vision. Journal of Vision, 9, 1-14.
Legge, G. E. (1978). Sustained and transient mechanisms in human vision: Temporal and spatial properties. Vision Research, 18, 69-81.
Lima, S. L. (1987). Vigilance while feeding and its relation to the risk of predation. Journal of Theoretical Biology, 124, 303-316.
Lima, S. L. & Bednekoff, P. A. (1999). Back to the basics of antipredatory vigilance: Can nonvigilant animals detect attack? Animal Behaviour, 58, 537-543.
Lima, S. L. & Dill, L. M. (1990). Behavioral decisions made under the risk of predation: a review and prospectus. Canadian Journal of Zoology, 68, 619-634.
Lima, S. L., Wiebe, K. L. & Dill, L. M. (1987). Protective cover and the use of space by finches: is closer better? Oikos, 50, 225-230.
Magal, C., Dangles, O., Caparroy, P. & Casas, J. (2006). Hair canopy of cricket sensory system tuned to predator signals. Journal of Theoretical Biology, 241, 459-66.
Magurran, A. E. & Girling, S. L. (1986). Predator model recognition and response habituation in shoaling minnows. Animal Behaviour, 34, 510-518.
Martin, G. R. (2014). The subtlety of simple eyes: The tuning of visual fields to perceptual challenges in birds. Philosophical Transactions of the Royal Society B, 369, 20130040.
McIlwain, J. T. (1996). An Introduction to the Biology of Vision. Cambridge: Cambridge University Press.
Milinski, M. (1990). Information overload and food selection. In Hughes, R. N. (ed.) Behavioural Mechanisms of Food Selection. Berlin: Springer, pp. 721-737.
Misslin, R. (2003). The defense system of fear: behavior and neurocircuitry. Clinical Nerophysiology, 33, 55-66.
Pettigrew, J. D., Dreher, B., Hopkins, C. S., McCall, M. J. & Brown, M. (1988). Peak density and distributions of ganglion cells in the retinae of microchiropteran bats: Implications for visual acuity. Brain, Behavior and Evolution, 32, 39-56.
Phelps, S. M. (2007). Sensory ecology and perceptual allocation: New prospects for neural networks. Philosophical Transactions of the Royal Society B, 362, 355-367.
Quinn, J. & Cresswell, W. (2005). Escape response delays in wintering redshank, Tringa totanus, flocks: Perceptual limits and economic decisions. Animal Behaviour, 69, 1285-1292.
Randolet, J., Lucas, J. R. & Fernández-Juricic, E. (2014). Non-redundant social information use in avian flocks with multisensory stimuli. Ethology, 120, 375-387.
Regan, D. & Vincent, A. (1995). Visual processing of looming and time to contact throughout the visual field. Vision Research, 35, 1845-1857.
Roth, T. C. & Lima, S. L. (2007). The predatory behavior of wintering Accipiter hawks: Temporal patterns in activity of predators and prey. Oecologia, 152, 169-178.
Schaller, G. B. & Emlen, J. T. (1962). The ontogeny of avoidance behaviour in some precocial birds. Animal Behaviour, 10, 370-381.
Schiff, W. (1965). Perception of impending collision: A study of visual directed avoidant behavior. Psychological Monographs, 79, 1-26.
Tisdale, V. & Fernández-Juricic, E. (2009). Vigilance and predator detection vary between avian species with different visual acuity and coverage. Behavioral Ecology, 20, 936-945.
Tyrrell, L. P., Butler, S. R., Yorzinski, J. L. & Fernández-Juricic, E. (2014). A novel system for bi-ocular eye-tracking in vertebrates with laterally placed eyes. Methods in Ecology and Evolution, 5, 1070-1077.
Von Campenhausen, M. & Kirschfeld, K. (1998). Spectral sensitivity of the accessory optic system of the pigeon. Journal of Comparative Physiology A, 183, 1-6.
Voss, J. & Bischof, H.-J. (2003). Regulation of ipsilateral visual information within the tectofugal visual system in zebra finches. Journal of Comparative Physiology A, 189, 545-553.
Walls, G. L. (1942). The Vertebrate Eye and its Adaptive Radiation. New York: Hafner.
Ydenberg, R. C. & Dill, L. M. (1986). The economics of fleeing from predators. Advances in the Study of Behaviour, 16, 229-249.
Yorzinski, J. L. & Platt, M. L. (2014). Selective attention in peacocks during predator detection. Animal Cognition, 17, 767-777.
Zani, A. & Proverbio, A. M. (2012). Is that a belt or a snake? Object attentional selection affects the early stages of visual sensory processing. Behavioral and Brain Functions, 8, 6.