Why Aren't We Saving the Planet?: A Psychologist's Perspective - Geoffrey Beattie (2010)
Part I. Notes on attitude
Chapter 7. Unconscious eye movements and what the brain sees
I need to change tack now, to show the results of a very different sort of psychology experiment, one that was extremely time-consuming and laborious to carry out, as we now started to monitor the unconscious eye movements of individuals looking at packaging. (Luckily I had a second dedicated research assistant, Laura McGuire, to take the lead on this.) Why weren’t people buying the low-carbon-footprint products given how positive their underlying attitudes were? I needed to track unconscious eye movements to determine what the brain actually sees when it looks at a product, to see whether this might hold a clue (perhaps they simply never noticed the carbon footprint information). This could prove to be illuminating in many ways. Thousands of minute dots on a computer screen had to be individually coded, but it was essential to finding out what is going on at the most basic level of human perception when people glance at products.
So how does this fit in with the bigger issues? Let me remind you. According to the Stern Review (2006:1), ‘The scientific evidence is now overwhelming: climate change presents very serious global risks, and it demands an urgent global response.’ Many people have argued that the retail sector has a crucial role to play in this global fight against climate change (and, of course, it was this and similar arguments that persuaded Tesco to introduce carbon labelling on some of its products and to fund research in this area). According to Forum for the Future (2007):
Retail has a vital role to play in delivering sustainable development. It employs 2.9 million people and generates almost 6% of the GDP of the UK. It is responsible for approximately 2.5% of the UK’s carbon dioxide emissions and has a disproportionate influence over society and the economy through its marketing, regular customer transactions and complex, globalised supply chains. (2007:8)
Therefore, in order to reduce greenhouse gas emissions, it is vital that consumers reduce the carbon footprints of the products they buy. One common argument is that this is best done not through legislation or prohibition, by restricting what consumers can or cannot buy, but by providing all consumers with appropriate information about the carbon footprint of a product so that they can make an informed choice, effectively empowering consumers and revolutionising our patterns of consumption.
As Sir Terry Leahy (Chief Executive of Tesco) commented (2007), ‘To achieve a mass movement in green consumption we must empower everyone - not just the enlightened or the affluent.’ This philosophy resulted in the inclusion of carbon footprint information on an increasing number of products, which should guide consumers (en masse) to greener choices: assuming, of course, that they have the right underlying attitude to ‘green’ or low-carbon-footprint products in the first place. This latter point is crucial because if consumers don’t have the right positive attitude to low-carbon-footprint products, it is unlikely that the inclusion of carbon footprint information will have any effect on consumer choice or behaviour. However, the studies that I have just outlined provide evidence that, in a sample of UK consumers in 2008, the vast majority not only had positive explicit attitudes to low-carbon-footprint products, as measured by the usual self-report measures, but also had very positive implicit attitudes to such products, as measured by the Implicit Association Test (IAT). These studies, therefore, give some psychological weight to the fundamental argument that we may, in fact, be able to reduce greenhouse gas emissions through consumer behaviour, because it demonstrates that many consumers (and not just a green minority) have exactly the right underlying attitude to low-carbon-footprint products in the first place. Therefore, there is a cogent argument that, in the case of many consumers, the provision of the carbon footprint information will allow their underlying attitude to be realised in actual behaviour.
But, of course, things might not be quite as simple as this. In everyday shopping, consumers are bombarded with product information and there is the danger, therefore, that the carbon footprint information will be not attended to, neglected or lost during the shopping experience. The carbon footprint information may be out there (on some products), but is it attended to and processed in the appropriate time frame? As Louw and Kimber (2007:6) have noted:
In a standard supermarket the typical shopper passes about 300 brands per minute (Rundh 2005). This translates into less than one-tenth of a second for a single product to get the attention of the customer and spark purchase (Gelperowic and Beharrel 1994:7) … Even in high involvement situations, most consumers don’t have the time, ability or information to assess all the pros and cons before purchase. Instead they rely on various cues (e.g. brand name, packaging etc) to help them make their decision. (Zeithaml 1988)
Carbon footprint information has to stand out in this general cognitive environment in which time is very much of the essence, and much information has to be ignored or processed very superficially before the purchasing decision is made.
So how is carbon footprint information currently represented on products? The form of representation currently being tested in the UK uses iconography (an image in black-and-white of an actual ‘literal’ footprint), accompanied by substantial amounts of text, numbers and scientific abbreviations both on the footprint (e.g. ‘12 kg CO2’, ‘Compared to 100 W conventional 55 kg’) and above and below the footprint (e.g. ‘working with the Carbon Trust’, ‘per 1000 hrs of use’, ‘The carbon footprint of this light bulb is 12 kg per 1000 hours of use and we have committed to reduce the footprint of future equivalent light bulbs. By comparison the footprint for the equivalent conventional light bulb (100 W) is 55 kg per 1000 hours of use’). But all this information has to compete with large amounts of other information on the packaging (some also connected to ‘green’ issues, like the temperature that the detergent can be used at) on the fronts, backs and sides of products. For example, in three common products (sold in Tesco, UK), already labelled with carbon footprint information, this information has to compete with the information shown in Tables 7.1, 7.2 and 7.3.
These products thus have a range of pictures, diagrams, icons, numbers and text (with the text in different-sized fonts), all competing for the consumers’ attention in a very
Table 7.1 Information displayed on Tesco’s low-energy light bulb packaging
|
Light bulb - front view (in descending order of surface area) |
Light bulb - back view (in descending order of surface area) |
|
Product image (picture) |
Carbon footprint (icon with text, numbers, scientific abbreviations) |
|
‘Greener living’ (icon and phrase) |
Carbon footprint information (text, numbers, scientific abbreviations) |
|
‘Bayonet cap’ (diagram and name) |
‘Greener living’ (icon and phrase) |
|
‘EDF energy’ (icon and name) |
‘Bayonet cap’ (diagram and name) |
|
Wattage (number) |
‘EDF energy’ (icon and name) |
|
Life of the bulb (number) |
Wattage (number) |
|
Wattage equivalent (number) |
Wattage equivalent (number) |
|
Product name (bulb) |
Product name (bulb) |
|
Other |
Other |
Table 7.2 Information displayed on Tesco’s freshly squeezed orange juice carton
|
Orange juice - front view (in descending order of surface area) |
Orange juice - side view (in descending order of surface area) |
|
Product image (picture) |
Background image (picture) |
|
Nutritional information (numbers, words and symbols) |
Carbon footprint (icon with text, numbers, scientific abbreviations) |
|
Product name and information (Tesco orange 100% pure squeezed juice) |
Carbon footprint information (text, numbers, scientific abbreviations) |
|
Price (text, numbers and icon) |
‘Picked and processed within 24 hours’ (quote) |
|
‘NOT FROM CONCENTRATE’ (quote) |
Small product image (picture) |
|
‘With bits’ (quote) |
Price (text, numbers and icon) |
|
Other |
Other |
limited time frame. Again, as Louw and Kimber (2007:14) have noted:
Shoppers typically only look at a label for about five to seven seconds, regardless of how many elements or messages there are on the package. Therefore, adding additional messages to the package increases the likelihood that a shopper will miss any single message. For this reason it is generally recommended that only two to three key points of communication are placed on a front label. Adding more messages is likely to clutter the label (which often detracts from appeal and perceived quality), and makes it more difficult for people to absorb the key information/communication from the label. (Young 2003)
This might be a key recommendation from some researchers in this area, but it does not prevent some retailers from
Table 7.3 Information displayed on Tesco’s ‘Non-Bio’ liquid detergent container
|
Detergent - front view (in descending order of surface area) |
Detergent - back view (in descending order of surface area) |
|
30° (text and number) |
Product instructions (text) |
|
Product name (TESCO Non-Bio liquid detergent) |
Product information (text) |
|
Baby (picture) |
Carbon footprint information (text, numbers, scientific abbreviations) |
|
‘Dermatologically tested’ (quote) |
Barcode (code) |
|
‘Suitable for sensitive skin’ (quote) |
Carbon footprint (icon with text, numbers, scientific abbreviations) |
|
20 washes (number and text) |
1.5 litres (number and text) |
|
T-shirt (icon and text) |
Other |
|
Other |
including nine sets of key information on the front of the packaging of a light bulb (the one used in this experiment), seven on the front of the orange juice and eight on the front of the detergent. Moreover, the carbon footprint icon or the accompanying textual information is not represented on the front of any of these three products - instead it is represented on the backs of both the bulb and the detergent and on the side of the orange juice. The question then becomes: how salient is this carbon footprint information, especially under the time constraints of normal shopping, when many consumers are choosing products without much prior consideration (Hausman 2000; Silayoi and Speece 2004; see also Louw and Kimber 2007)? Time pressure must (by definition) reduce the detailed consideration of elements on a package, but how is attentional resource distributed to carbon footprint information compared to each of the other elements represented on the package?
One possible way of investigating this is by using eye-tracking technology to measure visual attention to each element on the packaging by tracking the overt movement of the eyes and measuring each period of fixation. Eye movements provide ‘an unobtrusive, sensitive, real-time behavioural index of ongoing visual and cognitive processing’ (Henderson and Ferreira 2004:18) and give us clear and reliable data on the allocation of attention (see also Holsanova, Holmberg and Holmqvist 2008). The basic operation of the eyes in processing information runs as follows.
When we read, look at a scene, or search for an object, we continually make eye movements called saccades. Between the saccades, our eyes remain relatively still during fixations for about 200-300 ms. There are differences in these two measures as a function of the particular task … Saccades are rapid movements of the eyes with velocities as high as 500° per second. Sensitivity to visual input is reduced during eye movements; this phenomenon is called saccadic suppression (Matin 1974) … We do not obtain new information during a saccade, because the eyes are moving so quickly across the stable visual stimulus that only a blur would be perceived (Uttal and Smith 1968) … As we look straight ahead, the visual field can be divided into three regions: foveal, parafoveal and peripheral. Although acuity is very good in the fovea (the central 2° of vision), it is not nearly so good in the parafovea (which extends out to 5° on either side of fixation), and it is even poorer in the periphery (the region beyond the parafovea). Hence, we move our eyes so as to place the fovea on that part of the stimulus we want to see clearly. (Rayner 1998:373-374; emphasis in original)
So the question becomes: what proportion of time do participants fixate on the carbon footprint information on each of the products, compared to each of the other categories of information represented on the same products? This is on the understanding that this measure of visual attention (with the fovea being directed at each information category) reflects the amount of processing of each of the different categories of information with clear implications for consumer behaviour and the efficacy of the carbon footprint approach for combating climate change.
Of course, the answer to this question won’t solely depend on the design or aesthetics of the product. Since the 1940s with the ‘New Look’ approach to perception, it has been clear that perception is an active and constructive process that often operates in a top-down fashion. Often critical are the needs and values of the perceiver. In a well-known study, Bruner and Goodman (1947) asked children from different socio-economic groups to estimate the size of coins by adjusting the diameter of a beam of light. Children from poorer backgrounds overestimated the size of the coins compared to richer children because, according to the authors of the paper, poorer children place higher value on such coins than richer children and this impacts on their basic processes of perception. This overestimation happens unconsciously and is outside the individuals’ awareness or control (see also Balcetis and Dunning 2006; Greenwald 1992). So the fact that many people hold positive implicit attitudes to low carbon footprints may well impact on their patterns of visual attention to the products. As Bowman, Su, Wyble and Barnard (2009) wrote: ‘Humans have an impressive capacity to determine what is salient in their environment and direct attention in a timely fashion to such items.’ Carbon labelling should be salient to participants in this experiment; the question is how impressive is their capacity to direct their visual attention at the carbon footprint information, in the context of competing information about price, nutritional content, value, usage, etc.
Three products were used (see Figures 7.1-7.6): a Tesco low-energy light bulb (part of the ‘Greener Living’ range), Tesco’s ‘Non-Bio’ liquid detergent and Tesco’s own-brand freshly squeezed orange juice. These were photographed on a flat matt background with the bulb’s front and back in a single shot as one image (front of bulb to the right, back of bulb to the left - view 1; front to the left, back to the right - view 2, in order to control for natural biases in patterns of left-right looking), the orange juice front and side as one image (front to the right - view 1; front to the left - view 2) and the detergent’s front and back as one image (front to the right - view 1; front to the left - view 2).
These images were shown in slide-show format on a Dell desktop computer monitor to ten participants with a 10-second exposure time for each slide (participants were merely told ‘to look at the images’). We set up an ASL Model 504 remote eye tracker in the laboratory, in front of the computer monitor on which the stimulus material was to be shown. The eye tracker employs a camera surrounded by infrared emitting diodes to illuminate the eye of the participant looking at a screen. The participant’s point of gaze on the screen is determined by the camera combining the position of the pupil and the corneal reflection. The remote camera in the eye tracker fed into a screen for the experimenter’s observation of the positioning of camera observing the eye. From a separate computer, the experimenter was able to adjust the illumination of the infrared camera and the ‘pan/tilt’ of the camera in the eye tracker to enable recognition of the pupil and corneal reflection.
The recordings were analysed using Irfan View and each 40 ms frame was manually coded in terms of participants looking at each of the possible information categories represented on the products or packaging. There were 10 participants × 6 slides × 10 seconds × 25 frames, providing something like 15,000 individual data points which were individually coded and analysed. Examples of the individual frames in the analysis are outlined in Figure 7.7
Visual attention in the first 5 seconds and the second 5 seconds were analysed separately. A third analysis focused on the first fixation of each participant on each slide. A fixation was defined as the eyes remaining still for a minimum of 200 ms - in other words, for five frames or more (see Rayner 1998:373). In the analysis of the first fixation of each participant, the exact duration of the fixation was also analysed. The scoring of each individual frame with respect to the informational categories was highly reliable.
Now for the details of what we found. In the case of the light bulb, considerable visual attention was directed at the carbon footprint icon in the first 10 seconds (a mean of 82.5 intervals of gaze directed at the icon; in other words participants looked at the carbon footprint icon for a mean of 3.3 out of 10 seconds). This was by far the commonest focus for visual attention in this time period. The second commonest focus was the accompanying carbon footprint information (printed above and below the actual icon), and this competed most closely with other information about the energy backers of the product (EDF energy) and the fact that this product came from the ‘Greener Living’ range. The information that the bulb lasted for 6 years was also a common focus of visual attention. In other words, in the case of the light bulb much of the visual attention seemed to focus on ‘green’ aspects of the product (see Figure 7.8).
When these 10-second periods of visual attention were broken down into the first and second 5 seconds, some interesting differences started to emerge. Although the carbon footprint icon was looked at for a mean of 40.0 intervals in the first 5 seconds, and 42.5 in the second 5 seconds (thus showing a remarkable degree of consistency), this was not the case with the accompanying information about carbon footprint. This information was only looked at for 8.7 intervals in the first 5 seconds and 39.5 in the second 5-second period. This showed the most striking divergence in any of the information categories examined. In terms of the first 5 seconds, after the carbon footprint icon, the most frequently looked-at category was the EDF energy label followed by the ‘Greener Living’ label. It appears, therefore, that in the case of the low-energy light bulb, participants were primed to seek information relative to green issues and they did this more or less within the time frame that they would normally have in supermarkets for viewing products in making their consumer choices (see Figure 7.9).
In the case of the orange juice, the main attentional focus in the first 10 seconds was on the information that the oranges were picked and processed within 24 hours (a mean of 79.8 intervals), followed by the product image (a mean of 64.2 intervals). The third major focus of attention in the case of the orange juice was the price (this ranking excludes the category ‘other’, which is the residual category). The focus on the carbon footprint icon was lower down the list (a mean
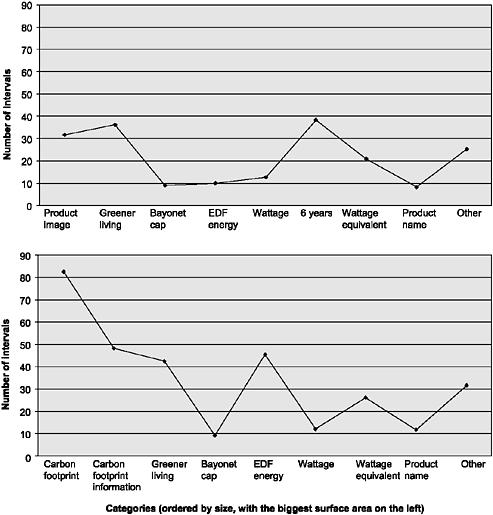
Figure 7.8 Number of (40 ms) intervals with gaze directed at each category, for the first 10 seconds of viewing: (top) light bulb, front; (bottom) light bulb, back.
of 33.1 intervals), but was still higher than the attentional focus on the nutritional information (a mean of 27.3 intervals). The accompanying information about carbon footprint was lower down again, competing in terms of attentional focus with things like ‘not from concentrate’ and the reminder of the price on the side view of the juice packaging (see Figure 7.10).
Looking separately at the attentional focus for the first 5 seconds and the second 5 seconds, again some interesting differences emerged (see Figure 7.11). Unlike the low-energy
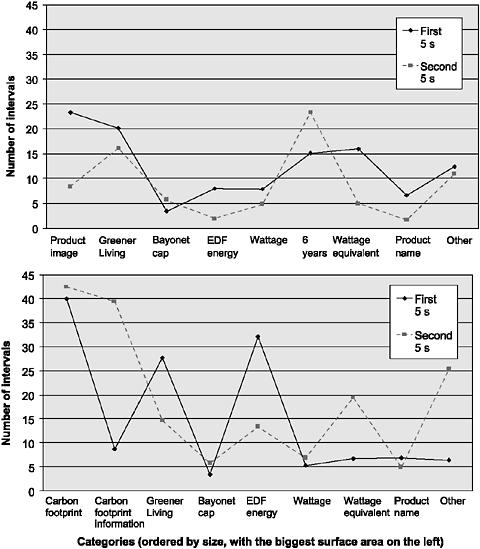
Figure 7.9 Number of (40 ms) intervals with gaze directed at each category, for the first and second 5 seconds of viewing: (top) light bulb, front; (bottom) light bulb, back.
light bulb, the carbon footprint icon was typically not fixated for very long in the first 5 seconds, but was only really fixated in the second 5 seconds; indeed, the amount of fixation in the second 5 seconds increased by a factor of 3. However, the accompanying information about carbon footprint did not go up nearly as steeply between the first and the second 5-second intervals. Nutritional information was hardly focused on at all in the first 5 seconds (a mean of 5.8 intervals), representing just over 1/5 of a second of actual
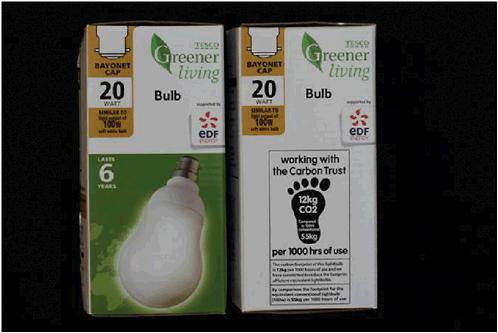
Figure 7.1 Light bulb: view 1.
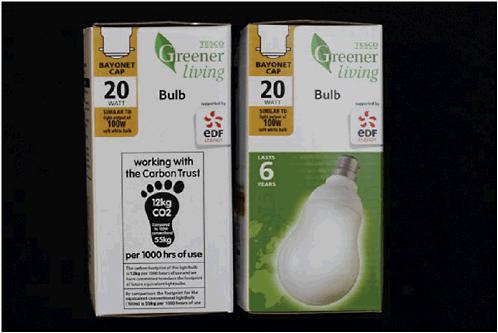
Figure 7.2 Light bulb: view 2.
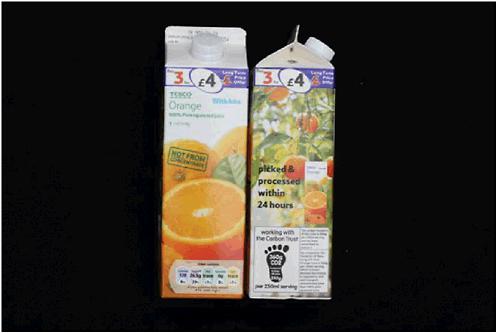
Figure 7.3 Orange juice: view 1.
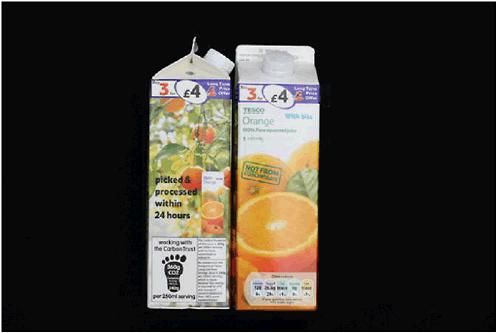
Figure 7.4 Orange juice: view 2.
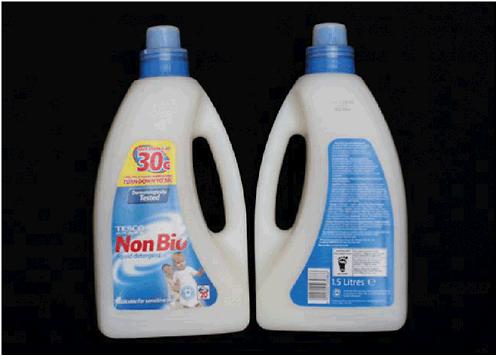
Figure 7.5 Detergent: view 1.
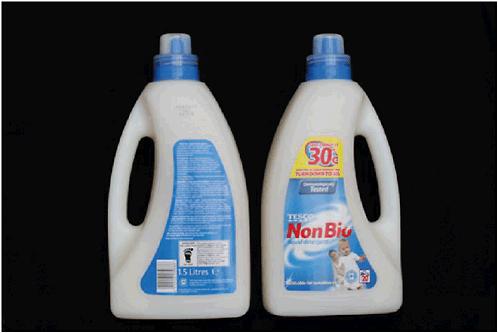
Figure 7.6 Detergent: view 2.
Figure 7.7 Eye tracking example.
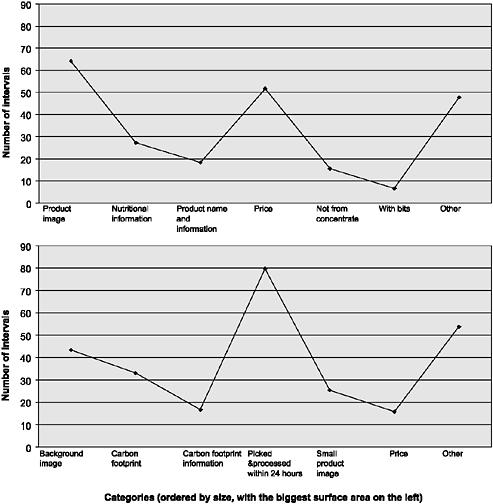
Figure 7.10 Number of (40 ms) intervals with gaze directed at each category, for the first 10 seconds of viewing: (top) orange juice, front; (bottom) orange juice, side.
looking, whereas it increased in the second 5 seconds by a factor of 4. So it looks as if in the case of nutritional information people need longer to get round to reading the textual information about nutritional value, but this pattern of increased focus on relevant textual material does not quite generalise to carbon footprint information.
In the case of the detergent, the main focus of visual attention in the first 10 seconds seemed to be that this detergent can be used at 30° (a mean of 80.8 intervals) followed by the product name (a mean of 62.8 intervals) and the product instructions (57.7 intervals). Of course, the
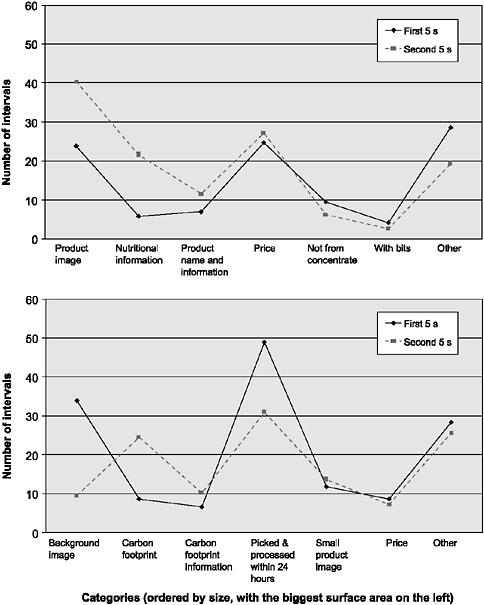
Figure 7.11 Number of (40 ms) intervals with gaze directed at each category, for the first and second 5 seconds of viewing: (top) orange juice, front; (bottom) orange juice, side.
temperature at which you wash clothes is relevant to issues concerning sustainability, but it is not the carbon footprint per se that is attended to here. The carbon footprint icon (a mean of 4.6 intervals) was looked at less than the fact that the product was suitable for sensitive skin (a mean of 4.8 intervals) and the information that there was 1.5 litres in the container (a mean of 5.4 intervals). The accompanying information about carbon footprint was looked at more, but this did not really compete with the main foci of visual attention for the detergent. Interestingly, in the case of the detergent (but not with the other products), there seemed to be a relationship between the surface area of the representation of the information and the proportion of time spent looking at it, as can be seen in Figure 7.12.
In terms of the possible differences between the first and second 5 seconds of visual regard, again some interesting differences emerged. The fact that this detergent can be used
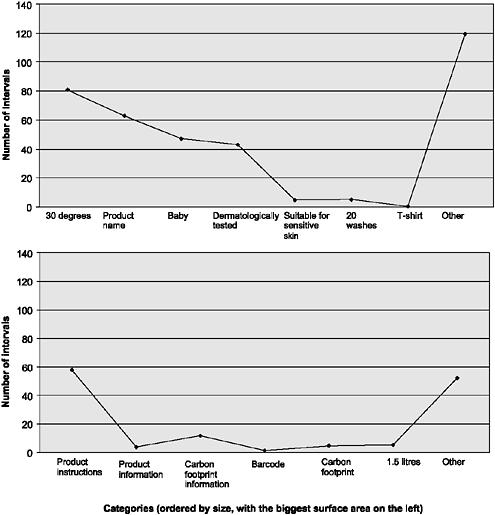
Figure 7.12 Number of (40 ms) intervals with gaze directed at each category, for the first 10 seconds of viewing: (top) detergent, front; (bottom) detergent, back.
at 30° was looked at in the first 5 seconds, but this dropped dramatically in the second 5 seconds. The carbon footprint icon was looked at more in the first than in the second 5 seconds (and indeed hardly at all in the second period - a mean of 20 ms). Similarly, the carbon footprint information was looked at more in the first than in the second 5 seconds, but not necessarily with the kinds of duration that would entail adequate understanding (see Figure 7.13).
In the case of all three products, statistical analyses revealed that our experimental participants spent significantly longer looking at information not related to the carbon footprint information (either the carbon footprint icon or the accompanying information) except in three particular cases - the second 5 seconds looking at the light bulb (view 1), the second 5 seconds looking at the light bulb (view 2) and the first 10 seconds looking at the light bulb (view 2). These results clearly show that visual attention to the carbon footprint information was significantly greater in the case of the light bulb than on either of the other products, where there was significantly more attention on the non-carbon footprint information than on the carbon footprint information (see Table 7.4).
What has emerged so far is what looks like a clear difference in the pattern of visual attention across the different products (inferred through patterns of statistical significance and non-significance). A number of direct statistical tests were then carried out comparing the proportion of time participants spent looking at either the carbon footprint icon or the carbon footprint information between the various products (keeping each of the product image views separate), as shown in Table 7.5.
These statistical analyses revealed a number of significant differences; for example, there was more visual attention to the carbon footprint information on the light bulb in the first 5 seconds than to the carbon footprint on the orange juice (both view 2). Similarly there was more visual attention to the carbon footprint on the light bulb in the first 10 seconds than to the carbon footprint on the orange juice (again view 2). There was also significantly more visual attention to the carbon footprint of the light bulb than to
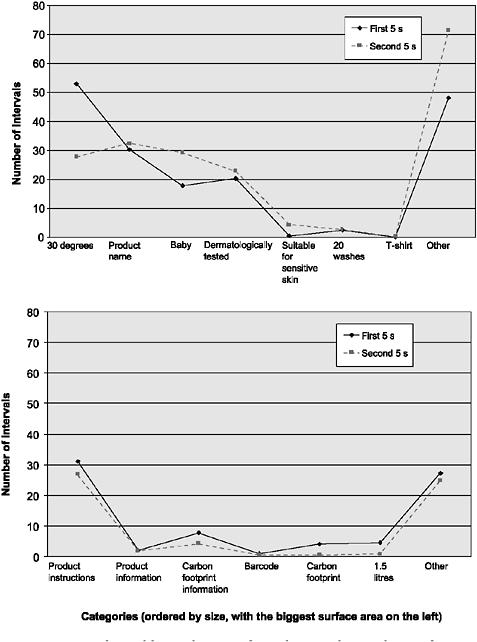
Figure 7.13 Number of (40 ms) intervals with gaze directed at each category, for the first and second 5 seconds of viewing: (top) detergent, front; (bottom) detergent, back.
the carbon footprint of the detergent in each of the six individual comparisons carried out.
In terms of the comparison between the orange juice and the detergent there was significantly more visual attention to the carbon footprint of the orange juice in the second
Table 7.4 Mean number of intervals (40 ms) spent looking at the carbon footprint (icon plus info) and other information (non-CF) for each of the three products
|
CF |
Non-CF |
||
|
Light bulb view 1 |
First 5 seconds |
11.8 |
113.2 |
|
Second 5 seconds |
33.7 |
91.3 |
|
|
First 10 seconds |
45.5 |
204.5 |
|
|
Light bulb view 2 |
First 5 seconds |
36.9 |
88.1 |
|
Second 5 seconds |
48.3 |
76.7 |
|
|
First 10 seconds |
85.2 |
164.8 |
|
|
Orange juice view 1 |
First 5 seconds |
8.8 |
116.2 |
|
Second 5 seconds |
26.8 |
98.2 |
|
|
First 10 seconds |
35.6 |
214.4 |
|
|
Orange juice view 2 |
First 5 seconds |
6.4 |
118.6 |
|
Second 5 seconds |
7.8 |
117.2 |
|
|
First 10 seconds |
14.2 |
235.8 |
|
|
Detergent view 1 |
First 5 seconds |
6.6 |
118.4 |
|
Second 5 seconds |
1.0 |
124.0 |
|
|
First 10 seconds |
7.6 |
242.4 |
|
|
Detergent view 2 |
First 5 seconds |
5.2 |
119.8 |
|
Second 5 seconds |
3.6 |
121.4 |
|
|
First 10 seconds |
8.8 |
241.2 |
5 seconds (view 1) and in the overall 10-second interval (view 1). However, with the alternative view - view 2 (that is, the front of the product on the left in the photograph) - there were no significant differences. In other words, this array of statistical comparisons revealed a rank ordering in the products in terms of visual attention to the carbon footprint information in the first 10 seconds, with the bulb in first place, the orange juice in second place and the detergent last.
The analysis of the first fixation revealed striking individual differences in terms of where our experimental participants fixated for the first time when they looked at the packaging of certain products. There were also striking individual differences in terms of how long each of these
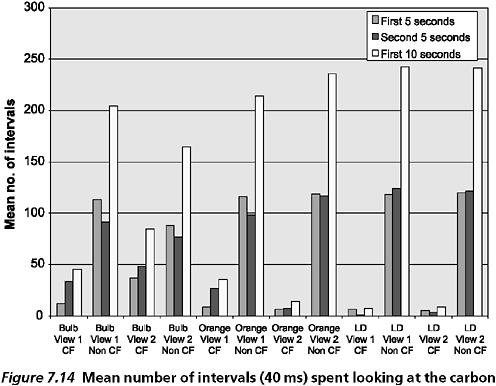
Figure 7.14 Mean number of intervals (40 ms) spent looking at the carbon footprint (icon plus info) for each of the three products.
first fixations lasted for. Participant 1 (light bulb, view 1) looked first at the wattage information on the light bulb with a fixation of 200 ms, whereas participant 3 (light bulb, view 1) looked first at the EDF label with a much longer opening fixation of 2.5 seconds. Interestingly, participant 7’s first fixation on the light bulb (view 1) was on the carbon footprint icon with an initial fixation of 480 ms. With 10 participants and 6 slides there were 60 initial fixations to consider and out of those, only 4 were on the carbon footprint icon (and none were on the accompanying carbon footprint information). In other words, in less than 7% of all cases did participants fixate immediately on either the carbon footprint icon or the accompanying carbon footprint information when they looked at the packaging of products in which the carbon footprint was clearly labelled.
So what conclusions can we draw from all of this? There is a major argument proposed by many prominent individuals that one way of tackling climate change, and halting the year-on-year increase in greenhouse gas emissions, is to
Table 7.5 Mean number of intervals (40 ms) spent looking at the carbon footprint (icon plus info) for each of two products compared statistically
|
Seconds |
Product view |
Product view |
Statistical comparisons |
|
Light bulb (view 1) |
Orange juice (view 1) |
||
|
First 5 |
11.8 |
8.8 |
not significant |
|
Second 5 |
33.7 |
26.8 |
not significant |
|
First 10 |
45.5 |
35.6 |
not significant |
|
Light bulb (view 2) |
Orange juice (view 2) |
||
|
First 5 |
36.9 |
6.4 |
significant |
|
Second 5 |
48.3 |
7.8 |
not significant |
|
First 10 |
85.2 |
14.2 |
significant |
|
Light bulb (view 1) |
Detergent (view 1) |
||
|
First 5 |
11.8 |
6.6 |
significant |
|
Second 5 |
33.7 |
1.0 |
significant |
|
First 10 |
45.5 |
7.6 |
significant |
|
Light bulb (view 2) |
Detergent (view 2) |
||
|
First 5 |
36.9 |
5.2 |
significant |
|
Second 5 |
48.3 |
3.6 |
significant |
|
First 10 |
85.2 |
8.8 |
significant |
|
Orange juice (view 1) |
Detergent (view 1) |
||
|
First 5 |
8.8 |
6.6 |
not significant |
|
Second 5 |
26.8 |
1.0 |
significant |
|
First 10 |
35.6 |
7.6 |
significant |
|
Orange juice (view 2) |
Detergent (view 2) |
||
|
First 5 |
6.4 |
5.2 |
not significant |
|
Second 5 |
7.8 |
3.6 |
not significant |
|
First 10 |
14.2 |
8.8 |
not significant |
empower consumers to make informed adjustments to their patterns of consumption, by providing them with relevant and accurate information about carbon footprint. The fact that many people do seem to have a strong positive implicit attitude to low carbon footprint products lends some credence to this general view. People would seem to be (already) primed to change their behaviour. A number of retailers (including Tesco in the UK) are now selling products with carbon footprint information clearly marked on their own-brand products to allow this empowering process to commence.
But the interesting psychological question is to what extent the carbon footprint information (usually consisting of an icon plus accompanying textual material) successfully directs the consumers’ visual attention to itself, in competition with all the other information that appears on the packaging or on the products themselves. Detailed analyses of the recording of each participant’s pattern of looking (each 40 ms frame was manually coded) during two 5-second periods of regard revealed that with certain products significant amounts of attention were directed at the carbon footprint and it did occur within the first few seconds. In our research, which compared three different products, most visual attention was directed at the carbon footprint of a low-energy light bulb compared with the carbon footprint of a carton of orange juice or a container of detergent. Least visual attention was directed at the carbon footprint of the detergent. In the case of the light bulb, attention was directed within the first 5 seconds at the carbon footprint icon, but attention only moved to the accompanying textual material in the second 5-second period (with only minimal attention in the first 5 to this textual material). It seemed to take much longer for participants to attend to the basic carbon footprint icon in the case of the orange juice (only really appearing in the second 5-second interval), and in the case of this product they hardly attended to the accompanying information at all. In the case of the detergent there was minimal visual attention to any aspect of the carbon footprint.
Bowman, Su, Wyble and Barnard (2009) recently wrote that ‘Humans have an impressive capacity to determine what is salient in their environment and direct attention in a timely fashion to such items.’ Carbon labelling on products, which some see as a major part of the solution to the issue of climate change, should surely be a salient part of all of our everyday lives, but it seems that it is only the carbon footprint of certain products that is really salient (at least within the critical 5-second time frame of everyday supermarket shopping). Our research also found that the carbon label (the carbon footprint icon plus the accompanying information) was the focus of the first fixation of our participants in only about 7% of all cases (and only 10% of the first fixations even in the case of the low-energy light bulb). In other words, the carbon label is not where participants look first. From a psychological point of view the only way that carbon labelling will ultimately work is if the information is designed in such a way that it does become the primary focus of visual attention in the first few seconds. At the moment this appears to occur only with certain products, which we already associate with being ‘green’. How we redesign products to make this information stand out more thus becomes a critical issue in the fight against climate change, as does the issue of how we go about making carbon footprint information more emotionally salient to people generally. The reason for this is that we know that emotional valence, and our values more generally, affect our perceptions of the world (Bruner and Goodman 1947). They even affect the moment-to-moment unconscious eye movements that are the crucial building blocks of this process of perception (and also, of course, the subject of our own research).
The overall implication is that if we are to combat climate change by providing consumers with carbon footprint information, then we will need to consider much more carefully how to make this carbon footprint information significantly more salient, because if the carbon label is not ‘seen’ in the right time frame, then it simply cannot be effective. This process will involve not just changing the packaging of products (essentially a design issue, but guided by psychologists who understand the limits of time-dependent cognitive processing) but also (and somewhat more dauntingly) it will involve changing certain aspects of the fundamental psychology of consumers (and not just their implicit attitudes, which already seem positive), because salience (as we all know) really is in the eyes of the beholder. So until we change crucial aspects of the psychology of the beholder, none of this activity on carbon labelling will really work, despite the very best of intentions.