The Car Hacker's Handbook: A Guide for the Penetration Tester - Craig Smith (2016)
Chapter 4. DIAGNOSTICS AND LOGGING
The OBD-II connector is primarily used by mechanics to quickly analyze and troubleshoot problems with a vehicle. (See “The OBD-II Connector” on page 17 for help locating the OBD connector.) When a vehicle experiences a fault, it saves information related to that fault and triggers the engine warning light, also known as the malfunction indicator lamp (MIL). These routine diagnostic checks are handled by the vehicle’s primary ECU, the powertrain control module (PCM), which can be made up of several ECUs (but to keep the discussion simple, we’ll refer to it only as the PCM).
If you trigger faults while experimenting with the bus on a vehicle, you’ll need to able to read and write to the PCM in order to clear them. In this chapter, we’ll learn how to fetch and clear diagnostic codes as well as query the diagnostic services of the ECU. We’ll also learn how to access a vehicle’s crash data recordings and how to brute-force hidden diagnostic codes.
Diagnostic Trouble Codes
The PCM stores fault codes as diagnostic trouble codes (DTCs). DTCs are stored in different places. For instance, memory-based DTCs are stored in the PCM’s RAM, which means they’re erased when power from the battery is lost (as is true for all DTCs stored in RAM). More serious DTCs are stored in areas that will survive a power failure.
Faults are usually classified as either hard or soft. Soft faults map to intermittent issues, whereas hard faults are ones that won’t go away without some sort of intervention. Often to determine whether a fault is hard or soft, a mechanic clears the DTCs and drives the vehicle to see whether the fault reappears. If it reappears, the fault is a hard fault. A soft fault could be due to a problem such as a loose gas cap.
Not all faults trigger the MIL light right away. Specifically, class A faults, which signal a gross emissions failure, light the MIL right away, while class B faults, which don’t affect the vehicle’s emissions system, are stored the first time they’re triggered as a pending fault. The PCM waits to record several of the same faults before triggering the MIL. Class C faults often won’t turn on the MIL light but instead trigger a “service engine soon” type of message. Class D faults don’t trigger the MIL light at all.
When storing the DTCs, the PCM snapshots all the relevant engine components in what is known as freeze frame data, which typically includes information such as the following:
✵ DTC involved
✵ Engine load
✵ Engine revolutions per minute (RPM)
✵ Engine temperature
✵ Fuel trim
✵ Manifold air pressure/mass air flow (MAP/MAF) values
✵ Operating mode (open/close loop)
✵ Throttle position
✵ Vehicle speed
Some systems store only one freeze frame, usually for the first DTC triggered or the highest-priority DTC, while others record multiple ones.
In an ideal world, these snapshots would happen as soon the DTC occurs, but the freeze frames are typically recorded about five seconds after a DTC is triggered.
DTC Format
A DTC is a five-character alphanumeric code. For example, you’ll see codes like P0477 (exhaust pressure control valve low) and U0151 (lost communication with restraint control module). The code in the first byte position represents the basic function of the component that set the code, as shown in Table 4-1.
Table 4-1: Diagnostic Code Layouts
|
Byte position |
Description |
|
1 |
P (0x0) = powertrain, B (0x1) = body, |
|
2 |
0,2,3 (SAE standard) 1,3 (manufacturer specific) |
|
3 |
Subgroup of position 1 |
|
4 |
Specific fault area |
|
5 |
Specific fault area |
NOTE
When set to 3, byte 2 is both an SAE-defined standard and a manufacturer-specific code. Originally, 3 was used exclusively for manufacturers, but pressure is mounting to standardize 3 to mean a standard code instead. In modern cars, if you see a 3 in the second position, it’s probably an SAE standard code.
The five characters in a DTC are represented by just two raw bytes on the network. Table 4-2 shows how to break down the 2 DTC bytes into a full DTC code.
Table 4-2: Diagnostic Code Binary Breakdown
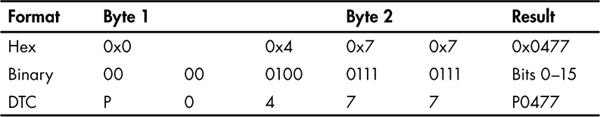
Except for the first two, the characters have a one-to-one relationship. Refer to Table 4-1 to see how the first two bits are assigned.
You should be able to look up the meaning of any codes that follow the SAE standard online. Here are some example ranges for common powertrain DTCs:
✵ P0001-P0099: Fuel and air metering, auxiliary emissions controls
✵ P0100-P0199: Fuel and air metering
✵ P0200-P0299: Fuel and air metering (injector circuit)
✵ P0300-P0399: Ignition system or misfire
✵ P0400-P0499: Auxiliary emissions controls
✵ P0500-P0599: Vehicle speed controls, and idle control systems
✵ P0600-P0699: Computer output circuit
✵ P0700-P0799: Transmission
To learn the meaning of a particular code, pick up a repair book in the Chilton series at your local auto shop. There, you’ll find a list of all OBD-II diagnostic codes for your vehicle.
Reading DTCs with Scan Tools
Mechanics check fault codes with scan tools. Scan tools are nice to have but not necessary for vehicle hacking. You should be able to pick one up at any vehicle supply store or on the Internet for anywhere between $100 and $3,000.
For the cheapest possible solution, you can get an ELM327 device on eBay for around $10. These are typically dongles that need additional software, such as a mobile app, in order for them to function fully as scan tools. The software is usually free or under $5. A basic scan tool should be able to probe the vehicle’s fault system and report on the common, nonmanufacturer-specific DTC codes. Higher-end ones should have manufacturer-specific databases that allow you to perform much more detailed testing.
Erasing DTCs
DTCs usually erase themselves once the fault no longer appears during conditions similar to when the fault was first found. For this purpose, similar is defined as the following:
✵ Engine speed within 375 RPM of the flagged condition
✵ Engine load within 10 percent of the flagged condition
✵ Engine temp is similar
Under normal conditions, once the PCM no longer sees a fault after three checks, the MIL light turns off and the DTCs get erased. There are other ways to clear these codes: you can clear soft DTCs with a scan tool (discussed in the previous section) or by disconnecting the vehicle’s battery. Permanent or hard DTCs, however, are stored in NVRAM and are cleared only when the PCM no longer sees the fault condition. The reason for this is simple enough: to prevent mechanics from manually turning off the MIL and clearing the DTCs when the problem still exists. Permanent DTCs give mechanics a history of faults so that they’re in a better position to repair them.
Unified Diagnostic Services
The Unified Diagnostic Services (UDS) is designed to provide a uniform way to show mechanics what’s going on with a vehicle without their having to pay huge license fees for the auto manufacturer’s proprietary CAN bus packet layouts.
Unfortunately, although UDS was designed to make vehicle information accessible to even the mom-and-pop mechanic, the reality is a bit different: CAN packets are sent the same way but the contents vary for each make, model, and even year.
Auto manufacturers sell dealers licenses to the details of the packet contents. In practice, UDS just works as a gateway to make some but not all of this vehicle information available. The UDS system does not affect how a vehicle operates; it’s basically just a read-only view into what’s going on. However, it’s possible to use UDS to perform more advanced operations, such as diagnostic tests or firmware modifications (tests that are only a feature of higher-end scan tools). Diagnostic tests like these send the system a request to perform an action, and that request generates signals, such as other CAN packets, that are used to perform the work. For instance, a diagnostic tool may make a request to unlock the car doors, which results in the component sending a separate CAN signal that actually does the work of unlocking the doors.
Sending Data with ISO-TP and CAN
Because CAN frames are limited to 8 bytes of data, UDS uses the ISO-TP protocol to send larger outputs over the CAN bus. You can still use regular CAN to read or send data, but the response won’t be complete because ISO-TP allows chaining of multiple CAN packets.
To test ISO-TP, connect to a CAN network that has diagnostic-capable modules such as an ECU. Then send a packet designed for ISO-TP over normal CAN using SocketCAN’s cansend application:
$ cansend can0 7df#02010d
Replies similar to 7e8 03 41 0d 00
In this listing, 7df is the OBD diagnostic code, 02 is the size of the packet, 01 is the mode (show current data; see Appendix B for a list of common modes and PIDs), and 0d is the service (a vehicle speed of 0 because the vehicle was stationary). The response adds 0x8 to the ID (7e8); the next byte is the size of the response. Responses then add 0x40 to the type of request, which is 0x41 in this case. Then, the service is repeated and followed by the data for the service. ISO-TP dictates how to respond to a CAN packet.
Normal CAN packets use a “fire-and-forget” structure, meaning they simply send data and don’t wait for a return packet. ISO-TP specifies a method to receive response data. Because this response data can’t be sent back using the same arbitration ID, the receiver returns the response by adding 0x8 to the ID and noting that the response is a positive one by adding 0x40 to the request. (If the response fails, you should see a 0x7F instead of the positive + 0x40 response.)
Table 4-3 lists the most common error responses.
Table 4-3: Common UDS Error Responses
|
Hex (4th byte) |
Abbreviation |
Description |
|
10 |
GR |
General reject |
|
11 |
SNS |
Service not supported |
|
12 |
SFNS |
Subfunction not supported |
|
13 |
IMLOIF |
Incorrect message length or invalid format |
|
14 |
RTL |
Response too long |
|
21 |
BRR |
Busy repeat request |
|
22 |
CNC |
Condition not correct |
|
24 |
RSE |
Request sequence error |
|
25 |
NRFSC |
No response from subnet component |
|
26 |
FPEORA |
Failure prevents execution of requested action |
|
31 |
ROOR |
Request out of range |
|
33 |
SAD |
Security access denied |
|
35 |
IK |
Invalid key |
|
36 |
ENOA |
Exceeded number of attempts |
|
37 |
RTDNE |
Required time delay not expired |
|
38-4F |
RBEDLSD |
Reserved by extended data link security document |
|
70 |
UDNA |
Upload/download not accepted |
|
71 |
TDS |
Transfer data suspended |
|
72 |
GPF |
General programming failure |
|
73 |
WBSC |
Wrong block sequence counter |
|
78 |
RCRRP |
Request correctly received but response is pending |
|
7E |
SFNSIAS |
Subfunction not supported in active session |
|
7F |
SNSIAS |
Service not supported in active session |
For example, if you use service 0x11 to reset the ECU and the ECU doesn’t support remote resets, you may see traffic like this:
$ cansend can0 7df#021101
Replies similar to 7e8 03 7F 11 11
In this response, we can see that after 0x7e8, the next byte is 0x03, which represents the size of the response. The next byte, 0x7F, represents an error for service 0x11, the third byte. The final byte, 0x11, represents the error returned—in this case, service not supported (SNS).
To send or receive something with more than the 8 bytes of data in a standard CAN packet, use SocketCAN’s ISO-TP tools. Run istotpsend in one terminal, and then run isotpsniffer (or isotprecv) in another terminal to see the response to your istotpsend commands. (Don’t forget to insmod your can-isotp.ko module, as described in Chapter 3.)
For example, in one terminal, set up a sniffer like this:
$ isotpsniffer -s 7df -d 7e8 can0
Then, in another terminal, send the request packet via the command line:
$ echo "09 02" | isotpsend -s 7DF -d 7E8 can0
When using ISO-TP, you need to specify a source and destination address (ID). In the case of UDS, the source is 0x7df, and the destination (response) is 0x7e8. (When using ISO-TP tools, the starting 0x in the addresses isn’t specified.)
In this example, we’re sending a packet containing PID 0x02 with mode 0x09 in order to request the vehicle’s VIN. The response in the sniffer should display the vehicle’s VIN, as shown here in the last line of output:
$ isotpsniffer -s 7df -d 7e8 can0
can0 7DF [2] 09 02 - '..'
can0 7E8 [20] 49➊ 02➋ 01➌ 31 47 31 5A 54 35 33 38 32 36 46 31 30 39 31 34 39
- 'I..1G1ZT53826F109149'
The first 3 bytes make up the UDS response. 0x49 ➊ is service 0x09 + 0x40, which signifies a positive response for PID 0x02 ➋, the next byte. The third byte, 0x01 ➌, indicates the number of data items that are being returned (one VIN in this case). The VIN returned is 1G1ZT53826F109149. Enter this VIN into Google, and you should see detailed information about this vehicle, which was taken from an ECU pulled from a wrecked car found in a junkyard. Table 4-4 shows the information you should see.
Table 4-4: VIN Information
|
Model |
Year |
Make |
Body |
Engine |
|
Malibu |
2006 |
Chevrolet |
Sedan 4 Door |
3.5L V6 OHV 12V |
If you were watching this UDS query via a normal CAN sniffer, you’d have seen several response packets on 0x7e8. You could re-assemble an ISO-TP packet by hand or with a simple script, but the ISO-TP tools make things much easier.
NOTE
If you have difficulty running the ISO-TP tools, make sure you have the proper kernel module compiled and installed (see “Installing Additional Kernel Modules” on page 42).
Understanding Modes and PIDs
The first byte of the data section in a diagnostic code is the mode. In automotive manuals, modes start with a $, as in $1. The $ is used to state that the number is in hex. The mode $1 is the same as 0x01, $0A is the same as 0x0A, and so on. I’ve listed a few examples here, and there are more in Appendix B for reference.
0x01: Shows current data
Shows data streams of a given PID. Sending a PID of 0x00 returns 4 bytes of bit-encoded available PIDs (0x01 through 0x20).
0x02: Shows freeze frame data
Has the same PID values as 0x01, except that the data returned is from the freeze frame state.
0x03: Shows stored “confirmed” diagnostic trouble codes
Matches the DTCs mentioned in “DTC Format” on page 52.
0x04: Erases DTCs and clears diagnostic history
Clears the DTC and freeze frame data.
0x07: Shows “pending” diagnostic codes
Displays codes that have shown up once but that haven’t been confirmed; status pending.
0x08: Controls operations of onboard component/system
Allows a technician to activate and deactivate the system actuators manually. System actuators allow drive-by-wire operations and physically control different devices. These codes aren’t standard, so a common scan tool won’t be able to do much with this mode. Dealership scan tools have a lot more access to vehicle internals and are an interesting target for hackers to reverse engineer.
0x09: Requests vehicle information
Several pieces of data can be pulled with mode 0x09.
0x0a: Permanent diagnostic codes
This mode pulls DTCs that have been erased via mode 0x04. These DTCs are cleared only once the PCM has verified the fault condition is no longer present (see “Erasing DTCs” on page 54).
Brute-Forcing Diagnostic Modes
Each manufacturer has its own proprietary modes and PIDs, which you can usually get by digging through “acquired” dealer software or by using tools or brute force. The easiest way to do brute force is to use an open source tool called the CaringCaribou (CC), available at https://github.com/CaringCaribou/caringcaribou.
CaringCaribou consists of a collection of Python modules designed to work with SocketCAN. One such module is a DCM module that deals specifically with discovering diagnostic services.
To get started with CaringCaribou, create an RC file in your home directory, ~/.canrc.
[default]
interface = socketcan_ctypes
channel = can0
Set your channel to that of your SocketCAN device. Now, to discover what diagnostics your vehicle supports, run the following:
$ ./cc.py dcm discovery
This will send the tester-present code to every arbitration ID. Once the tool sees a valid response (0x40+service) or an error (0x7f), it’ll print the arbitration ID and the reply ID. Here is an example discovery session using CaringCaribou:
-------------------
CARING CARIBOU v0.1
-------------------
Loaded module 'dcm'
Starting diagnostics service discovery
Sending diagnostics Tester Present to 0x0244
Found diagnostics at arbitration ID 0x0244, reply at 0x0644
We see that there’s a diagnostic service responding to 0x0244. Great! Next, we probe the different services on 0x0244:
$ ./cc.py dcm services 0x0244 0x0644
-------------------
CARING CARIBOU v0.1
-------------------
Loaded module 'dcm'
Starting DCM service discovery
Probing service 0xff (16 found)
Done!
Supported service 0x00: Unknown service
Supported service 0x10: DIAGNOSTIC_SESSION_CONTROL
Supported service 0x1a: Unknown service
Supported service 0x00: Unknown service
Supported service 0x23: READ_MEMORY_BY_ADDRESS
Supported service 0x27: SECURITY_ACCESS
Supported service 0x00: Unknown service
Supported service 0x34: REQUEST_DOWNLOAD
Supported service 0x3b: Unknown service
Supported service 0x00: Unknown service
Supported service 0x00: Unknown service
Supported service 0x00: Unknown service
Supported service 0xa5: Unknown service
Supported service 0xa9: Unknown service
Supported service 0xaa: Unknown service
Supported service 0xae: Unknown service
Notice that the output lists several duplicate services for service 0x00. This is often caused by an error response for something that’s not a UDS service. For instance, the requests below 0x0A are legacy modes that don’t respond to the official UDS protocol.
NOTE
As of this writing, CaringCaribou is in its early stages of development, and your results may vary. The current version available doesn’t account for older modes and parses the response incorrectly, which is why you see several services with ID 0x00. For now, just ignore those services; they’re false positives. CaringCaribou’s discovery option stops at the first arbitration ID that responds to a diagnostic session control (DSC) request. Restart the scan from where it left off using the -min option, as follows:
$ ./cc.py dcm discovery -min 0x245
In our example, the scan will also stop scanning a bit later at this more common diagnostic ID:
Found diagnostics at arbitration ID 0x07df, reply at 0x07e8
Keeping a Vehicle in a Diagnostic State
When doing certain types of diagnostic operations, it’s important to keep the vehicle in a diagnostic state because it’ll be less likely to be interrupted, thereby allowing you to perform actions that can take several minutes. In order to keep the vehicle in this state, you need to continuously send a packet to let the vehicle know that a diagnostic technician is present.
These simple scripts will keep the car in a diagnostic state that’ll prove useful for flashing ROMs or brute-forcing. The tester present packet keeps the car in a diagnostic state. It works as a heartbeat, so you’ll need to transmit it every one to two seconds, as shown here:
#!/bin/sh
while :
do
cansend can0 7df#013e
sleep 1
done
You can do the same things with cangen:
$ cangen -g 1000 -I 7DF -D 013E -L 2 can0
NOTE
As of this writing, cangen doesn’t always work on serial-line CAN devices. One possible workaround is to tell slcand to use canX style names instead of slcanX.
Use the ReadDataByID command to read data by ID and to query devices for information. 0x01 is the standard query. The enhanced version, 0x22, can return information not available with standard OBD tools.
Use the SecurityAccess command (0x27) to access protected information. This can be a rolling key, meaning that the password or key changes each time, but the important thing is that the controller responds if successful. For example, if you send the key 0x1, and it’s the correct access code, then you should receive an 0x2 in return. Some actions, such as flashing ROMs, will require you to send a SecurityAccess request. If you don’t have the algorithm to generate the necessary challenge response, then you’ll need to brute-force the key.
Event Data Recorder Logging
You likely know that airplanes have black boxes that record information about flights as well as conversations in the cockpit and over radio transmissions. All 2015 and newer vehicles are also required to have a type of black box, known as an event data recorder (EDR), but EDRs record only a portion of the information that a black box on an airplane would. The information stored on the EDR includes the following (you’ll find a more complete list in SAE J1698-2):
✵ Airbag deployment
✵ Brake status
✵ Delta-v (longitudinal change in velocity)
✵ Ignition cycles
✵ Seat belt status
✵ Steering angles
✵ Throttle position
✵ Vehicle speed
While this data is very similar to freeze frame data, its purpose is to collect and store information during a crash. The EDR constantly stores information, typically only about 20 seconds worth at any one time. This information was originally stored in a vehicle’s airbag control module (ACM), but today’s vehicles distribute this data among the vehicle’s ECUs. These boxes collect data from other ECUs and sensors and store them for recovery after a crash. Figure 4-1 shows a typical EDR.
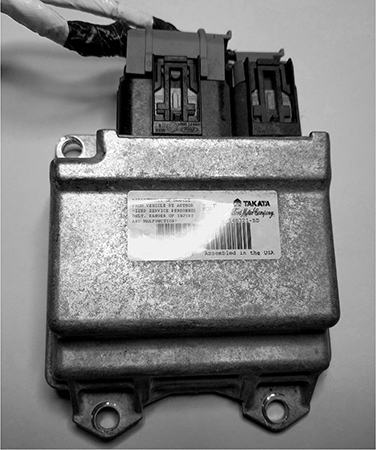
Figure 4-1: A typical event data recorder
Reading Data from the EDR
The official way to read data from an EDR is with a crash data retrieval (CDR) tool kit. A basic CDR tool will connect to the OBD connector and pull data (or image the vehicle) from the main ECU. CDR tools can also access data in other modules, such as the ACM or the rollover sensor (ROS) module, but they’ll normally need to be plugged in directly to those devices instead of using the OBD port. (You’ll find a comprehensive list of which vehicles have black box data that can be retrieved here: http://www.crashdatagroup.com/research/vehiclecoverage.html.)
CDR kits include both proprietary hardware and software. The hardware usually costs about $2,000, and the cost of the software will vary depending on how many vehicle types you want to support. The format of vehicle crash data is often considered proprietary as well, and many manufacturers license the communication protocol to tool providers that make CDRs. Obviously, this is not in the best interest of the consumer. The National Highway Traffic Safety Administration (NHTSA) has proposed the adoption of a standard OBD communication method to access this data.
The SAE J1698 Standard
The SAE J1698 standard lists recommended practices for event data collection and defines event records by sample rate: high, low, and static. High samples are data recorded at the crash event, low samples are pre-crash data, and static samples are data that doesn’t change. Many vehicles are influenced by the SAE J1698 but don’t necessarily conform to its rules for all data retrieved from a vehicle.
Some recorded elements are:
✵ Cruise control status
✵ Driver controls: parking brake, headlight, front wiper, gear selection, passenger airbag disabled switch
✵ Foremost seat track position
✵ Hours in operation
✵ Indicator status lights: VEDI, SRS, PAD, TPMS, ENG, DOOR, IOD
✵ Latitude and longitude
✵ Seating position
✵ SRS deployment status/time
✵ Temperature air/cabin
✵ Vehicle mileage
✵ VIN
While the SAE J1698 states latitude and longitude recordings, many manufacturers claim not to record this information for privacy reasons. Your research may vary.
Other Data Retrieval Practices
Not all manufacturers conform the to SAE J1698 standard. For example, since the 1990s, General Motors has collected a small amount of EDR data in the sensing and diagnostic module (SDM) of its vehicles. The SDM stores the vehicle’s Delta-v, which is the longitudinal change in the vehicle’s velocity. The SDM does not record any post-crash information.
Another example is Ford’s EDR, known as the restraint control module (RCM). Ford stores a vehicle’s longitudinal and lateral acceleration data rather than Delta-v. If the vehicle has electronic throttle control, the PCM stores additional EDR data, including whether the passenger was an adult or not, the percent the accelerator/brake pedal was depressed, and whether a diagnostic code was active when the crash occurred.
Automated Crash Notification Systems
Automated crash notification (ACN) systems are the phone-home systems that contact a vehicle’s manufacturer or a third party with event information. These coincide with other crash recovery systems and extend the functionality by contacting the manufacturer or third party. One major difference is that there aren’t rules or standards that determine what data is collected and sent to an ACN. ACNs are specific to each manufacturer, and each system will send different information. For example, the Veridian automated collision notification system (released in 2001) reports this information:
✵ Crash type (frontal, side, rear)
✵ Date and time
✵ Delta-v
✵ Longitude and latitude
✵ Make, model, and year of vehicle
✵ Principal direction of force
✵ Probable number of occupants
✵ Rollover (yes or no)
✵ Seat belt use
✵ Vehicle’s final resting position (normal, left side, right side, roof)
Malicious Intent
Attackers may target a vehicle’s DTCs and freeze frame data to hide malicious activity. For example, if an exploit needs to take advantage of only a brief, temporary condition in order to succeed, a vehicle’s freeze frame data will most likely miss the event due to delays in recording. Captured freeze frame snapshots rarely contain information that would help determine whether the DTC was triggered by malicious intent. (Because black box EDR systems typically trigger only during a crash, it’s unlikely that an attacker would target them because they’re not likely to contain useful data.)
An attacker fuzzing a vehicle’s system might check for fired DTCs and use the information contained in a DTC to determine which component was affected. This type of attack would most likely occur during the research phase of an attack (when an attacker is trying to determine what components the randomly generated packets were affecting), not during an active exploit.
Accessing and fuzzing manufacturer-specific PIDs—by flashing firmware or using mode 0x08—can lead to interesting results. Because each manufacturer interface is kept secret, it’s difficult to assess the actual risk of the network. Unfortunately, security professionals will need to reverse or fuzz these proprietary interfaces to determine what is exposed before work can be done to determine whether there are vulnerabilities. Malicious actors will need to do the same thing, although they won’t be motivated to share their findings. If they can keep undocumented entry points and weaknesses a secret, then their exploit will last longer without being detected. Having secret interfaces into the vehicle doesn’t increase security; the vulnerabilities are there regardless of whether people are allowed to discuss them. Because there’s money in selling these codes (sometimes upward of $50,000), the industry has little incentive to embrace the community.
Summary
In this chapter, you have gone beyond traditional CAN packets to understand more complex protocols such as ISO-TP. You have learned how CAN packets can be linked together to write larger messages or to create two-directional communications over CAN. You also learned how to read and clear any DTCs. You looked at how to find undocumented diagnostic services and saw what types of data are recorded about you and your driving habits. You also explored some ways in which diagnostic services can be used by malicious parties.